Using AI to Help Admin Your Fabrication Database
AI’s in the news everywhere. There’s no escaping it. So I’d like to highlight a couple examples of how I’ve used it to manage an Autodesk Fabrication Configuration.
Setting the Stage….
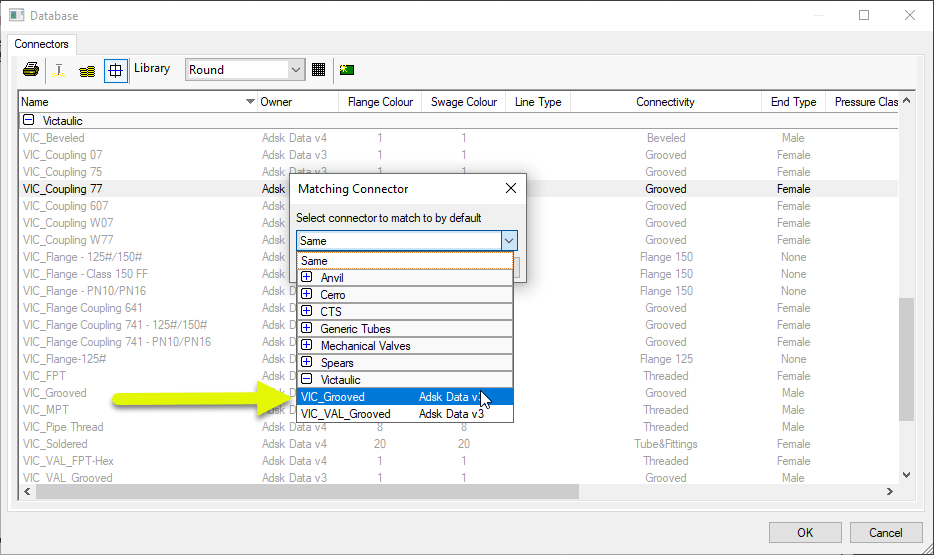
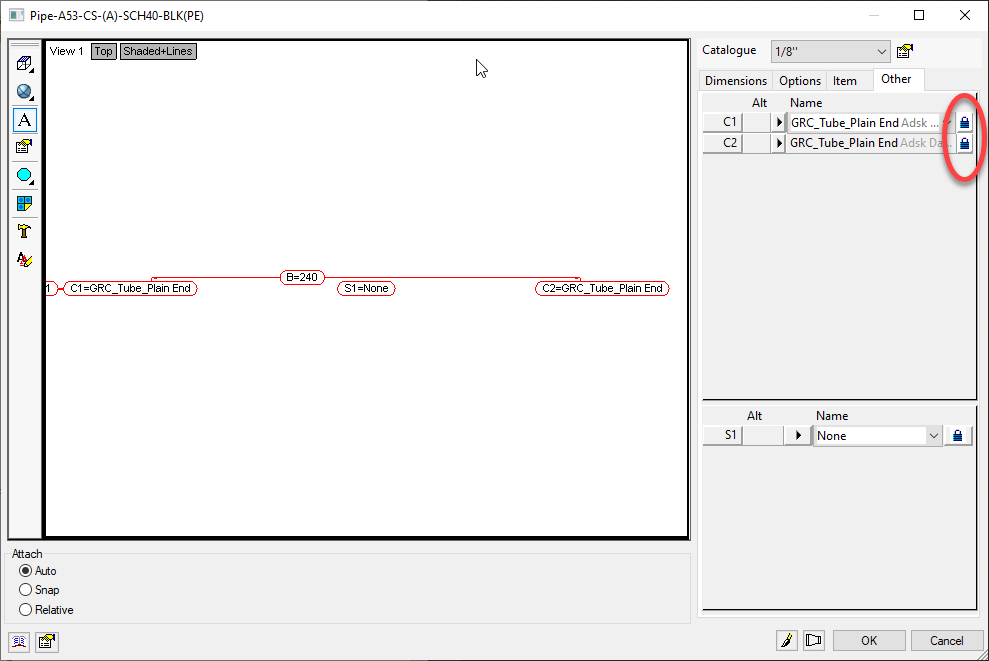
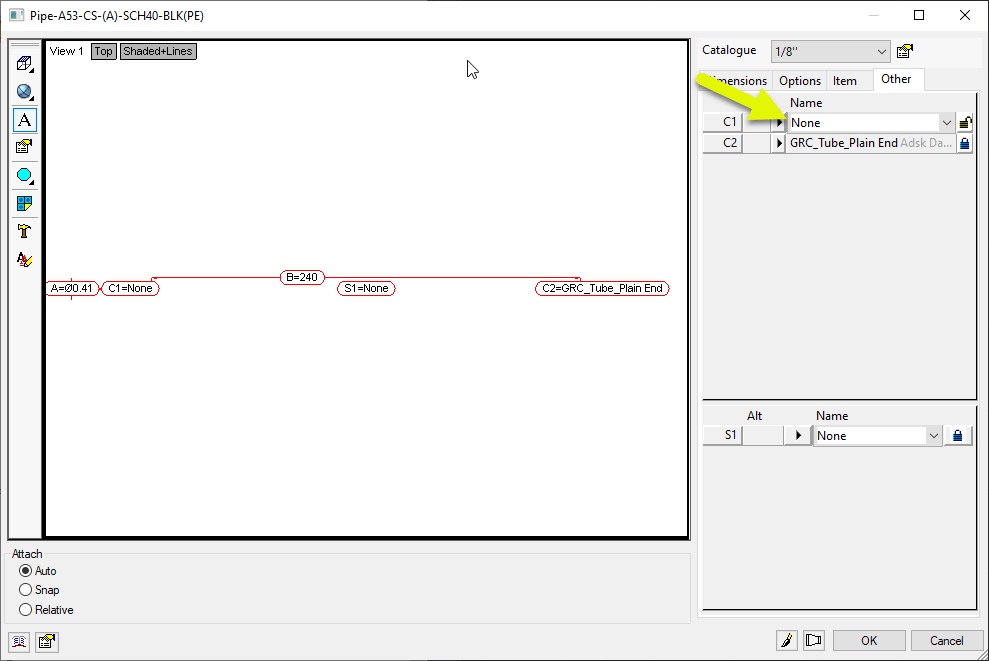
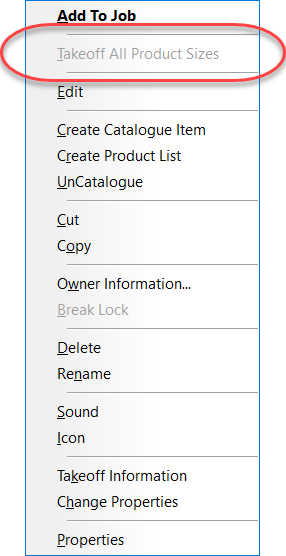
A Sheet Metal fabricator had a Seam acting goofy in their database. You’d look at an ITM or Specification and see the seam specified. But reports would show crazy weights and areas. When you tried to pick the Seam in an ITM or Specification, it would immediately display blank. If you reselected the same Seam again, it would stick and the error would go away.
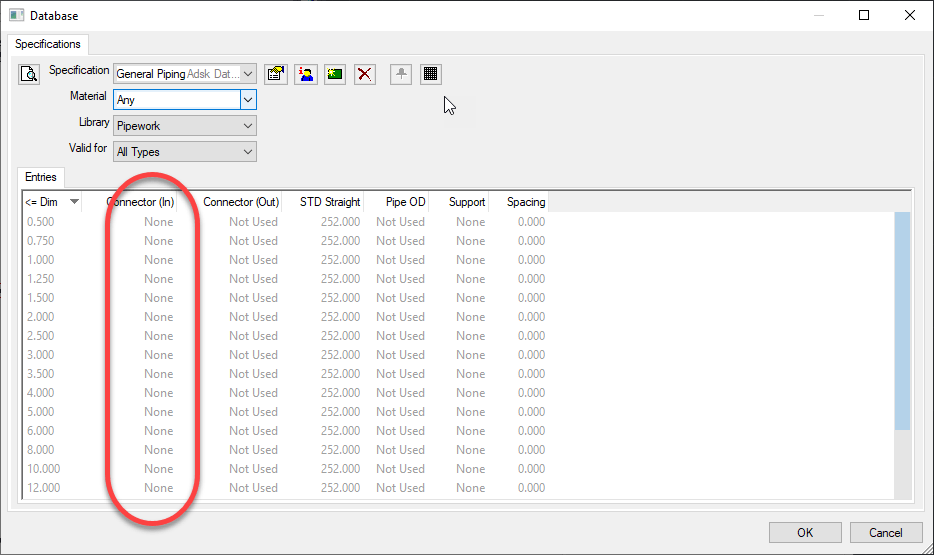
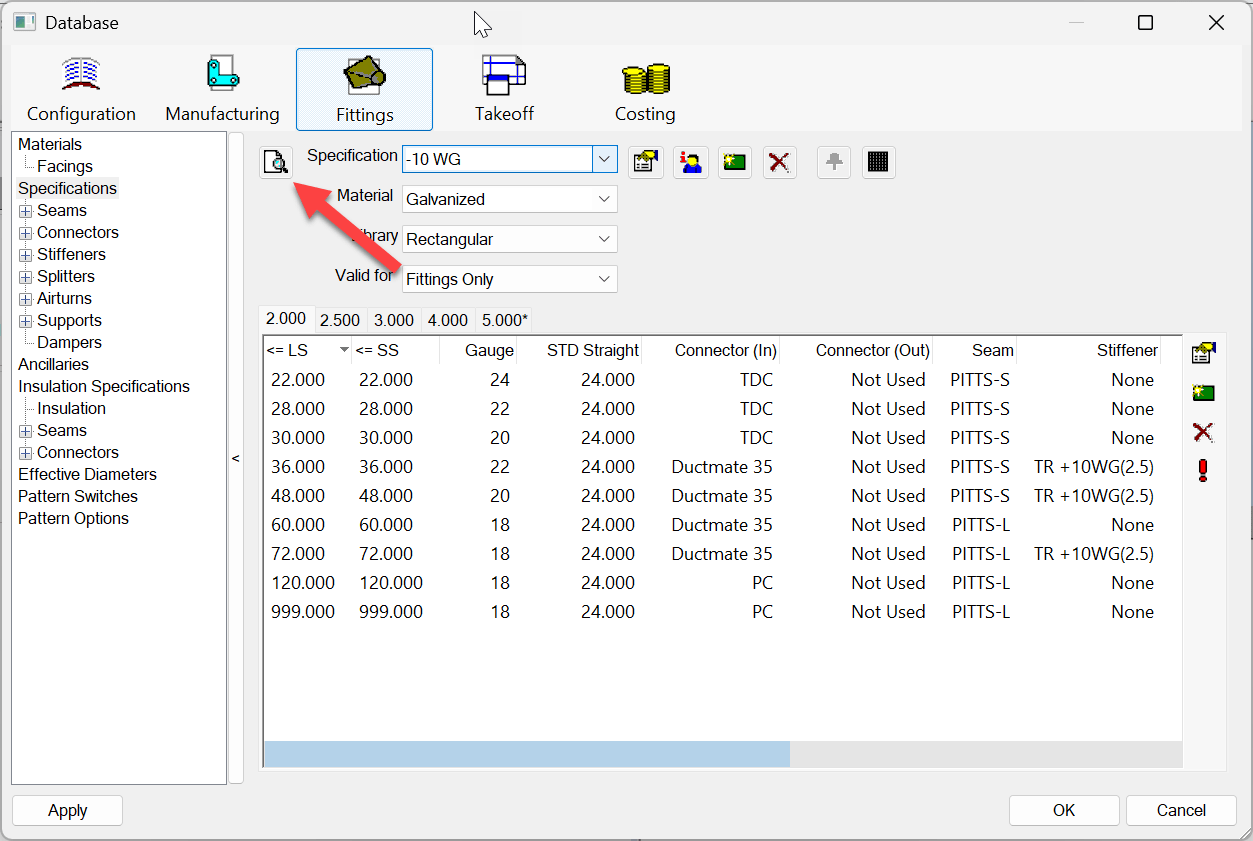
So, using the scripts I have this site, it was easy to find which ITM’s had this seam locked. You’d then go and fix them. But what about the Specifications? They would have had to review every single specification. And within each specification, review each material. And within each material of each specification, review each library. And for every library of each material of each specification, they’d also have to review the “Applies To” settings of All Types, Fittings Only and Straights Only. And from there, you’d then review each “Length” breakpoint table.
That’s a lot of work. Each to miss pick or loose track of where you are. Not to mention the hours that would take. So to help, we printed the Specifications. That resulting PDF was over 3,600 pages long when it printed all the tables. That’s still a lot of work to review. So this is where out AI story begins.
Process the PDF with AI
Because the PDF was so long, I figured we’d give Claude and ChatGPT a crack at it to summarize each Spec/Material/Library/Valid For setting using that specific Seam.
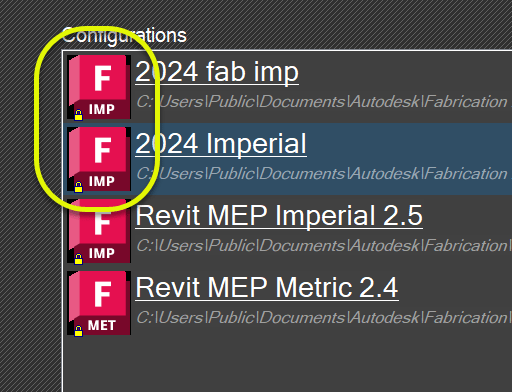
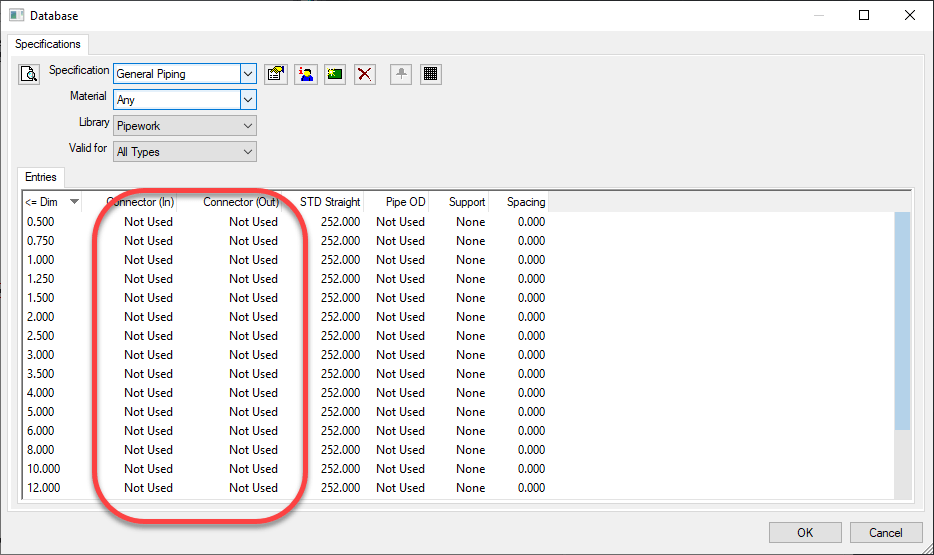
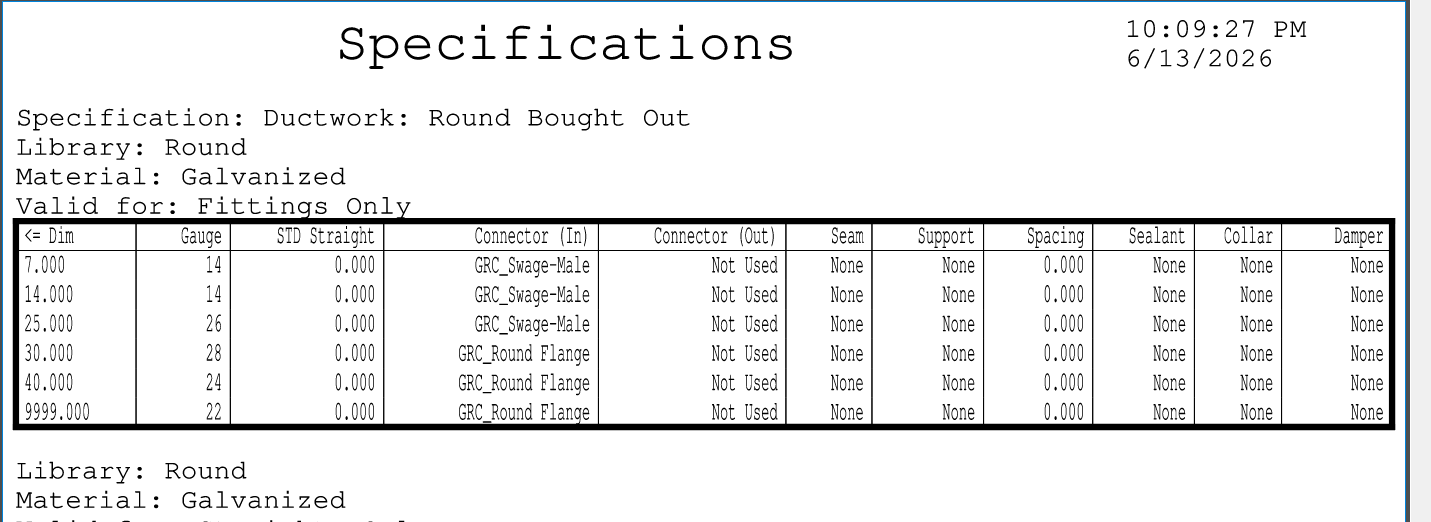
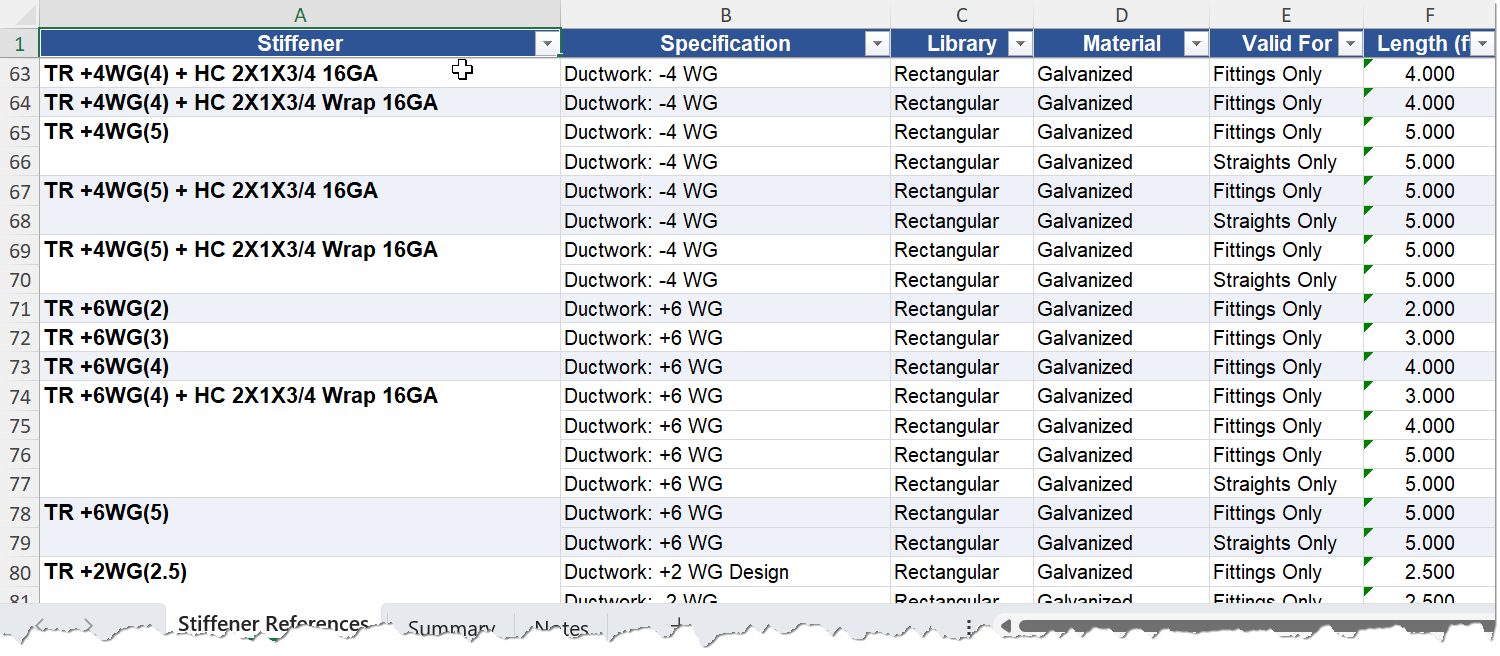
The following example is doing something similar. It’s using an out of the box Autodesk Fabrication Configuration. This time, I’m asking it to summarize Stiffeners by Specification. So before I edit a Stiffener configuration, I can see where it’s used. The PDF printout of the specifications looked something like this…
I uploaded this PDF to Claud (also tried ChatGPT with similar results). I used the following prompt…
Please review the supplied PDF. It lists specifications for Autodesk Fabrication software. Each specification  has a breakpoint table with one or more rows and several columns.

Above each table lists the properties of the specifications.  Things you'll find are...

"Specification"
"Abbreviation"
"Library"
"Material"
"Valid For"
"Length"

Once a "Specification" is listed, one ore more tables apply to it and it is no longer listed until the specification changes, then it's listed again, applying to the tables that follow it unless it's listed again.

Abbreviation can be ignored. But each specification comes in various "Library" versions. And within that, there's various "Materials" for each "Library". And within each material, there's separate "Valid For"  entries. Some tables may also have a "Length" entry with different lengths specified for different tables.

Valid library entries are... "Rectangular", "Round",  "Flat Oval" , "Standard", Pipework" and "Electrical".  "Valid For" entries can contain "All Types", "Fittings Only" and "Straights Only".

Can you give me a summary of all different "Stiffener" column entries and which "Specification", "Material", "Library", "Valid For" and "Length" (if applicable) reference those stiffeners?

The result should be a spreadsheet that lists each stiffener name and a reference to those specification headers combinations that reference it.
As you can see, I tried my best to describe the contents of the PDF and it’s structure. When done, this res the
Process the MAP files with AI
If AI can process a PDF…. I wonder if it can process a MAP files as found in the configuration. Well, the answer is Yes it can. Thanks to Scott Buchanan of Autodesk for the tip that this indeed works.
What I did find is that while Claude can reverse engineer a MAP file to find the entries, the relationship between the MAP files is a little more complicated. To perform the same summary as earlier, I had to upload SPECS.MAP, MATERIAL.MAP and STIFFENER.MAP. That’s because the specification file doesn’t list the stiffener or materials directly, They reference indexes. And Claude really knows nothing about Autodesk Fabrication’s internal structure. It took a LOT more work to describe to Claude how the tables relate to each other. I even had to tell it the entries (in order) for the “Library” and “Valid For” dropdown lists as the specifications file merely referenced their enumerated index values.
Ultimately, I ended up with a very similar spreadsheet. But it took nearly 10 attempts and a lot of coaching. But if you just wanted a list from a MAP file of the entries… like a list of Specification Names or Service names… Claude processing a MAP file works very well. You can get it to help analyze the relationship between tables, but be prepared for a lot more coaching.
Hope this helps give you some ideas on how you can use some of the modern AI tools to help you manage your Fabrication database.
Below are links to the PDF of the specifications I used in this example as well as the Spreadsheets from processing the PDF as well as MAP files directly.