There’s a bug that crept into Autodesk Fabrication versions that prevent some COD scripts from running. Any Script that accesses the Item Product list [item.product / item/product.*] will likely fail in the initial shipping version of 2026 and any prior Fabrication version’s update that was released on May 21, 2025.
Here’s what that error looks like when you attempt to run one of my scripts. The code you run may be different but you’ll see a “Simple Variable Not Expected” error in the script and the highlighted line will likely have “item.product….” somewhere in there.
This affects the scripts I have on this site including….
WriteAllDatabaseIDs (Job).cod
WriteAllMiscProperties(Job).cod
Extract Product List Data (Library).cod
WriteAllDatabaseIDs (Library).cod
WriteAllMiscProperties(Library).cod
Here’s a list of versions that work vs have the bug…
Version
Fabrication Bug
2026.0.0
Yes
2025.0.2
Yes
2025.0.1 & Earlier
No
2024.0.4
Yes
2024.0.3 & Earlier
No
2023.0.5
Yes
2023.0.4 & Earlier
No
Autodesk has confirmed this bug/defect and it should be fixed in an upcoming update. If you need to use COD scripts that accesses the product list data, I recommend using one of the versions without the bug until Autodesk releases a fix.
Thank you to my network for alerting me to this issue.
Thanks also to Craig Farish at Autodesk for digging in and validating the defect and queueing up a future fix. I tend to beat up Autodesk a bit, but Craig is one of the good guys behind the scenes helping our industry.
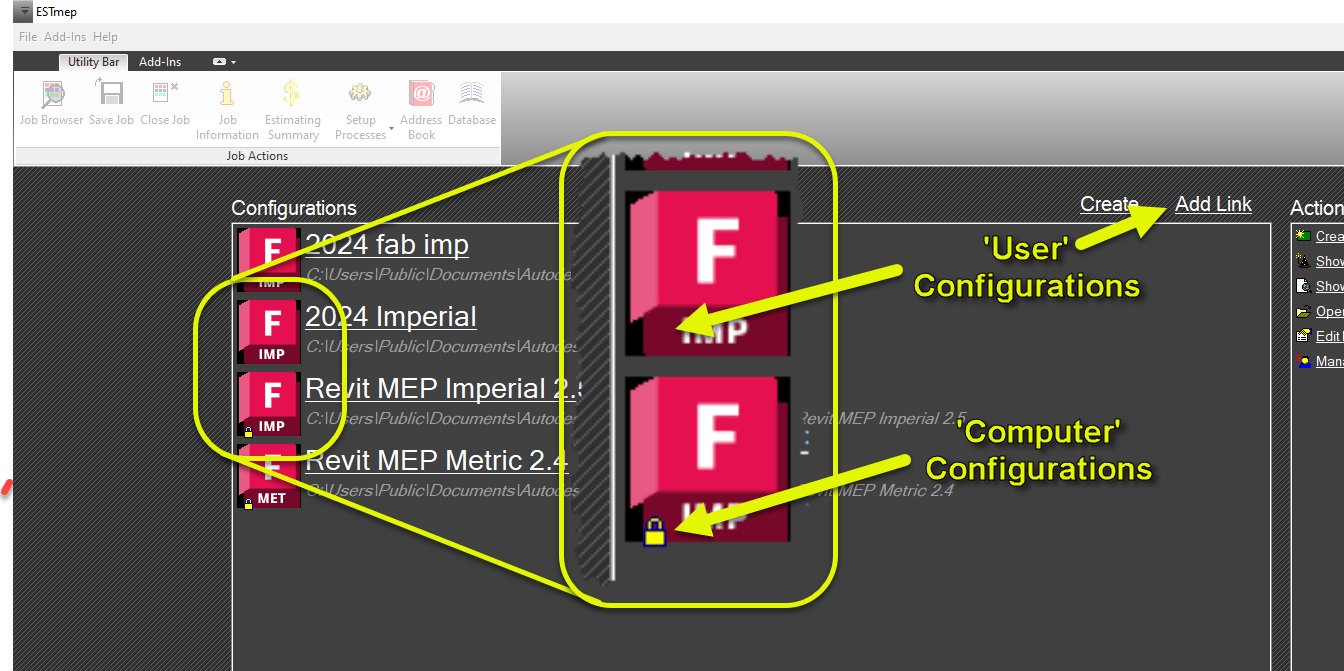
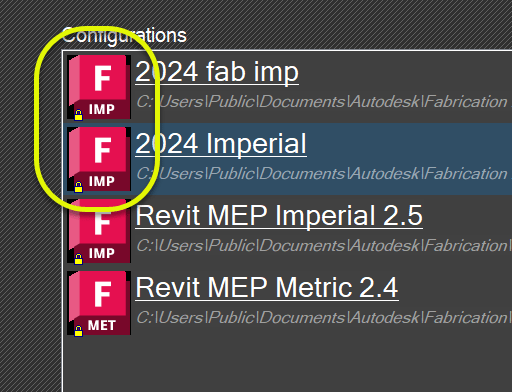
When you manually add a Fabrication Configuration to your system yourself, it only works for the currently logged in user. In fact, you may have noticed this with your own configurations compared to the default ones Autodesk adds during installation. You can see the difference by the presence of a little Yellow Lock icon in the lower left of the Configuration’s image.
So when you use the Add Link option to add a configuration, it’ll only exist for you. If someone else logs into the computer, the configuration won’t be displayed for the new user. Autodesk’s on the other hand…will still be there.
The difference between these two ways Configurations work is based on how the configurations are “configured” in the Windows Registry. So let’s take a look by starting the Registry Editor.
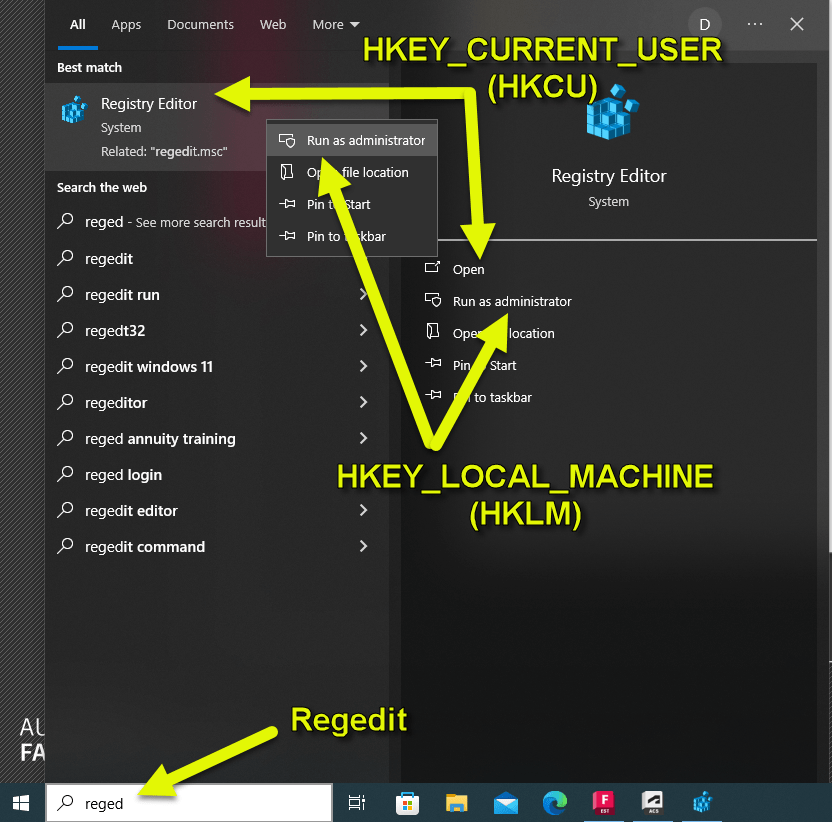
The first thing to know, is that there’s two ways to start the Registry. Just running the REGEDIT command opens the editor and displays everything. The other way is to Run as Administrator. When just run, you’ll have read/write access to the HKEY_CURRENT_USER branch (‘Hive’ is the proper term) often abbreviated as HKCU. This is the branch where the User configurations are stored.
The Computer based Configurations (like Autodesk’s) are stored in the HKEY_LOCAL_MACHINE branch often abbreviated as HKLM. When you run REGEDIT normally, you’ll see the HKLM branch but it’s Read-Only. To write to the HKLM branch, you’ll need to launch REGEDIT with the Run as Administrator option. Your IT Department may restrict this from you so you may need to involve them if you want to implement Computer based Fabrication Configurations.
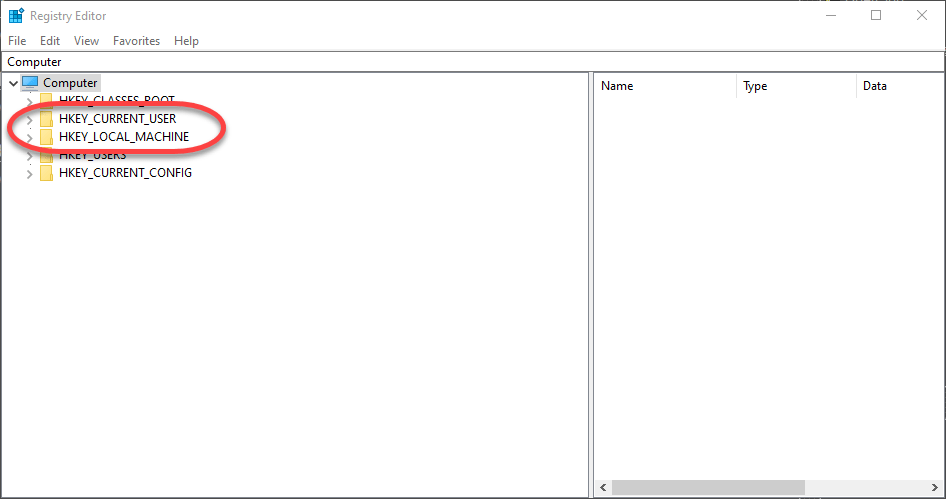
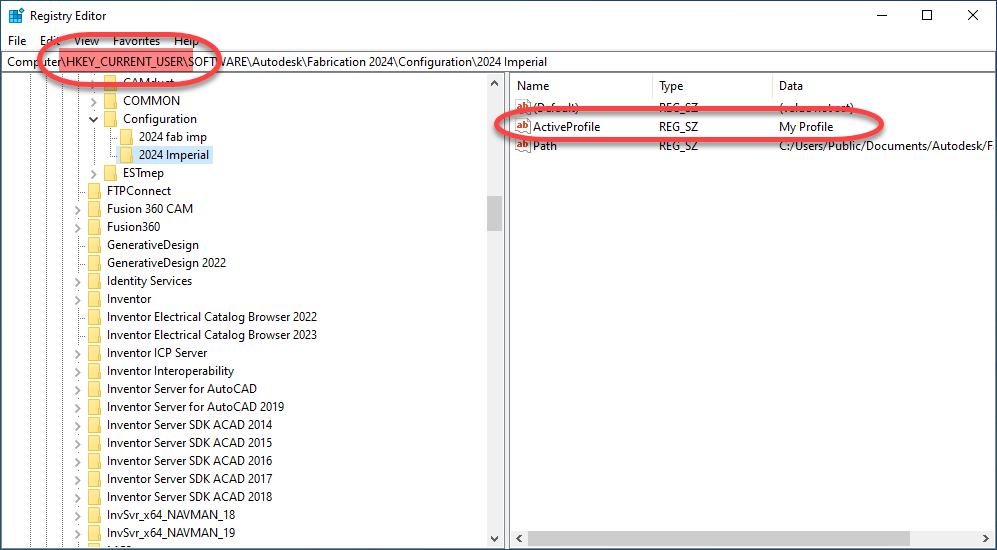
The other thing to note, is that when you Run as Administrator, the HKCU branch is there but the settings may be missing or different. This is because, the Registry Editor is technically running as another user and that branch is User specific. You can see the two branches I’ve referenced in the following image.
Converting Configurations to ‘Computer’ Based
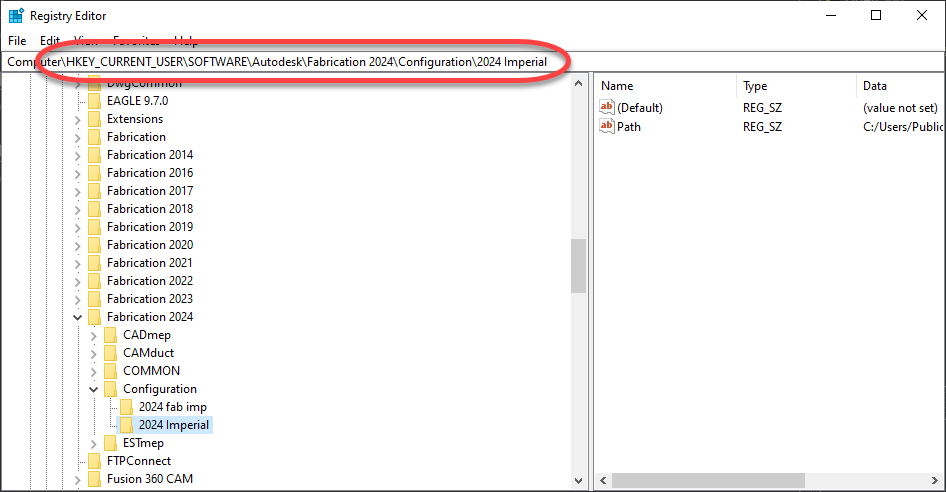
While you can edit the Registry manually, the easiest way to convert your Fabrication Configurations to be Computer based (not User) is to run the Registry Editor normally (not as Administrator) and export the HKEY_CURRENT_USER settings. The settings are in the key…
The <year> represents the version year of Autodesk Fabrication (CADmep, ESTmep, CAMduct, Remote Entry, etc.) or Revit. You can see that in the following image. If the Configuration key isn’t there, that means there’s no configurations “configured” for that version year. If a specific “year” isn’t listed, it means that version wasn’t installed.
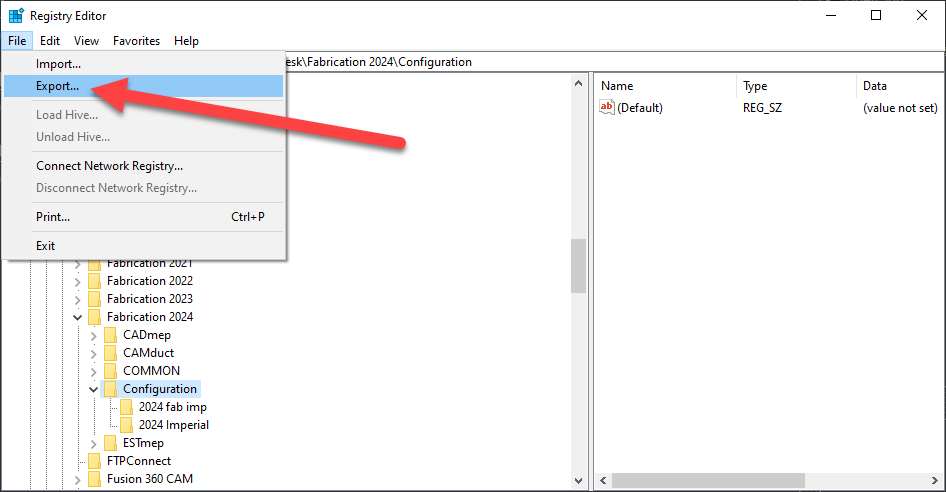
Once you get to the Configuration Key, you can export it using the File -> Export option as shown here…
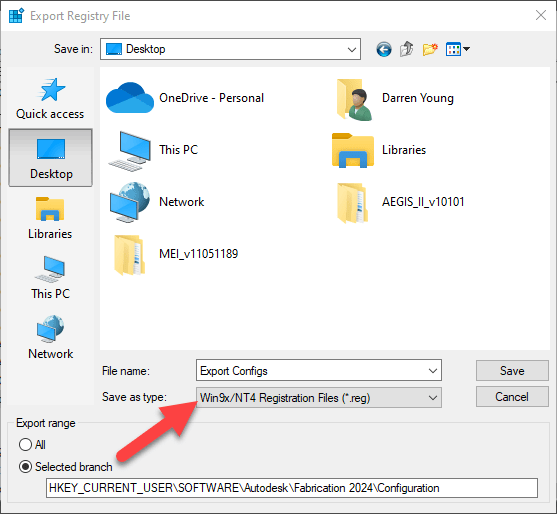
While you can Export a single configuration, I like to pick the Configuration Key and do them all. We can get rid of what we don’t want later. The main point to note when exporting is to change the Save as type: to the Win9x/NT4 Registration Files (*.reg) option. This will save the export in ASCII text which you can edit in Notepad.
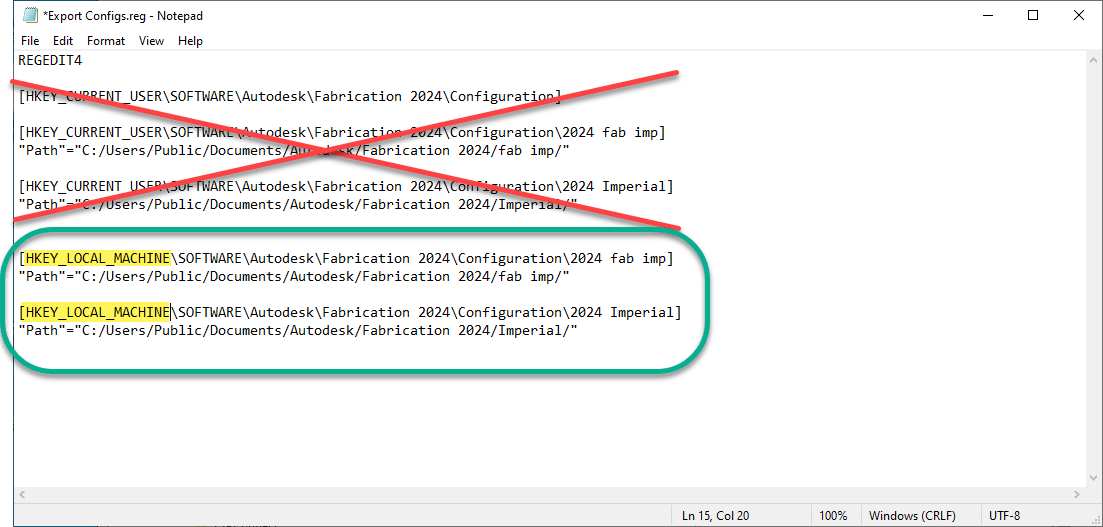
Once you export to a file, you can right click on the file and select Edit to open in Notepad. The following image shows how it looks and is marked up what I’ve removed vs added/edited. Note I also edited the Registry Hive from HKEY_CURRENT_USER to HKEY_LOCAL_MACHINE.
Once you’ve edited the file and saved it, you’re almost ready to import it. It’s generally not advisable to have the same configuration with the same name and same path in both the HKCU and HKLM branches.
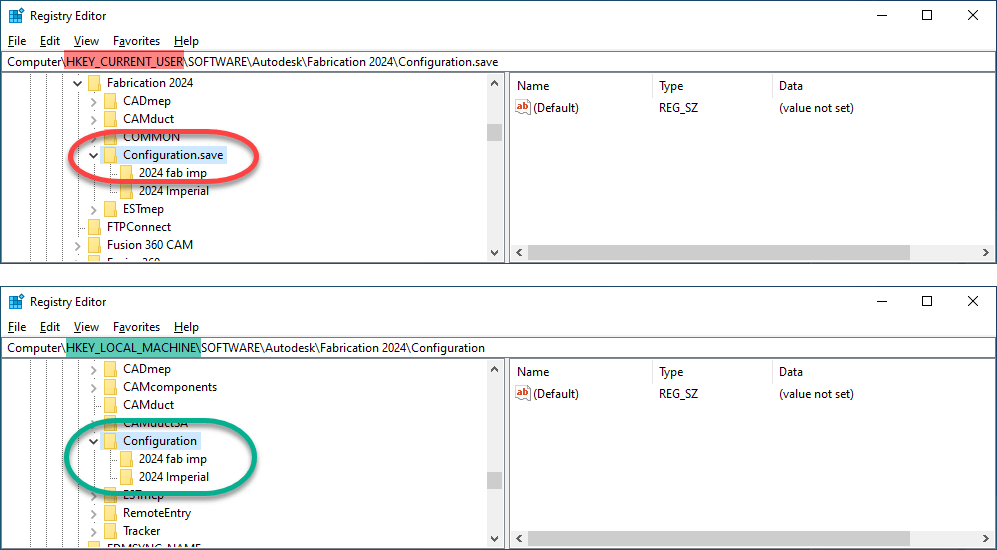
So first, you can run REGEDIT normally and rename the Configuration folder…or just delete it (if you’re comfortable doing so). Then close the Registry Editor and run it again but Run as Administrator. You can now Import the file you just edited to import those new Registry settings. The following image shows what both branches might look like…
Now, when you launch Fabrication (CADmep, CAMduct, ESTmep, etc.) you’ll see the little Yellow Lock icon on your configurations. Revit won’t show that little icon but it does honor the ‘User’ vs ‘Computer’ configurations.
A Word About Fabrication ‘Profiles’
One side effect of ‘Computer’ or machine based Fabrication Configurations shows up if you use Profiles in your Fabrication Configuration. It doesn’t apply to Revit but does CADmep, CAMduct and ESTmep. When you use Profiles with ‘User’ based Configurations, the last active profile will be the default when you launch the program again. With ‘Computer’ or machine based profiles, you’ll always default back to the Global profile.
However this is easily fixed. To start, let’s look at the ‘User’ based configurations under HKCU when a profile was used…
You’ll see there’s now an ActiveProfile value in the configuration that wasn’t there before. That’s how Fabrication knows which profile to load by default. But also remember, the HKLM branch of the registry is normally Read-Only. So this means those programs can’t create this value when you change profiles.
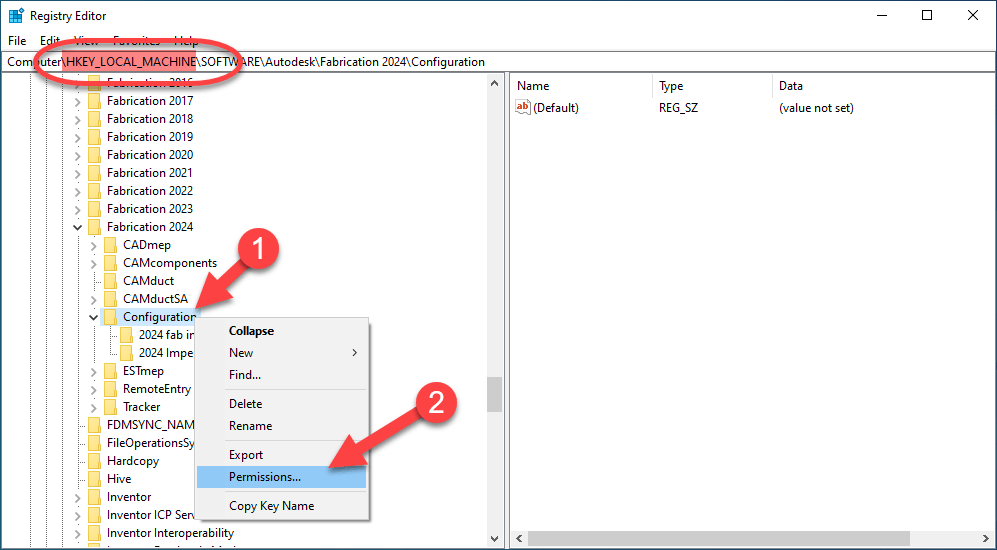
The solution to this, is making those registry keys Read-Write in the HKLM registry branch. You can do that by running REGEDIT as an administrator like before and navigating to the proper registry keys. From here, you can Right-Click on the Key’s name and select Permissions….
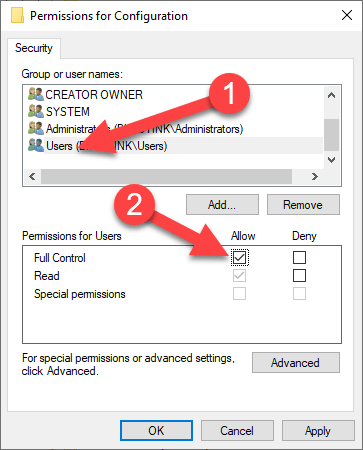
You can do this on a specific configuration or at the root Configuration key and the permissions will be inherited by the downstream keys. Once the Permissions dialog shows up, select the User permission group and select the Allow toggle for Full Control. Again, you may need your IT’s help if you don’t have permissions to do this.
This will now allow CADmep, CAMduct and ESTmep to save the last Fabrication Profile to the Registry in the HKLM branch so when you start the software the next time, it’ll be able to use the last Profile used.
One good side effect of changing these permissions…you’ll now also be able to import or create more Fabrication Configurations in HKLM in the future WITHOUT having to Run as Administrator as you’ll now have Read-Write permissions to those keys by default.
Make sure if you do these steps, to do them for all versions of Fabrication. You can even make entries for versions you don’t have installed so they work later if you install that version. So if you want to prepare for 2025 versions, you can copy/paste/edit those registry settings in the file you exported and rename them as 2025 (or older versions) all in the same file, Being proactive in this way will minimize future support downtime.
Autodesk has undergone numerous modifications to its licensing models over the years, leading to increased costs for customers. However, there are now three new developments that make it easier to reduce licensing costs, especially for those who previously used Network licenses. These developments are:
The elimination of FlexLM Network Licensing
The introduction of a new, consumption-based Flex Licensing
The integration of analytics into the Account Management Portal
By leveraging these changes, it is now possible to reduce licensing costs in a more cost-effective manner. Let’s take a closer look at each of these developments and understand the opportunities they provide. Numerous customers have reported savings of up to 30% on their renewals by implementing these concepts.
1) FlexLM Elimination
Autodesk made changes to its licensing model with the elimination of FlexLM Network licensing, offering a 2-for-1 trade-in of existing network seats to named user licenses. This resulted in reduced visibility on individual software usage and, in some cases, caused customers to become over-licensed. The absence of clear usage information prompted customers to purchase additional seats at full cost as they expanded their staff, leading to the likelihood of customers with large pools of network licenses having more licenses than necessary.
2) Rollout of ‘Flex’ Token Consumption Licenses
Autodesk introduced Flex licensing as a replacement for FlexLM. With this model, you buy a volume of tokens. Each product has a set token cost. Usage consumes tokens per day per user per product. The same person can use different versions of the same product or a different computer without consuming additional tokens. Only using a different product or on a different day will result in additional token consumption. No cost is incurred if the product is not used. This licensing model is more cost-effective than full-cost assigned licenses for part-time users, although less flexible than previous network licensing.
3) Usage Analytics
Autodesk recently made license usage analytics available to all customers, not just those with Premium Support. These analytics let you monitor how your Autodesk licenses are being used among your users. Although they may not have the same level of data accuracy as FlexLM, they still provide valuable information to help you determine if the Flex Licensing model is more cost-effective for a user compared to a dedicated named user license.
However, to effectively compare costs with named license products, you need to consider the usage mix of products in a Collection. The Autodesk Management Portal’s Usage Reporting displays product usage but can be difficult to understand with a mix of products used by the same user. Some resellers offer PowerBI reports but still face the same challenge.
A better approach is to examine past usage and assign a theoretical cost under Flex licensing. You can easily compare this number to a named user license to determine what’s best for a given user.
I’ll share a simplified process. Those with basic Excel knowledge should be able to perform the analysis. For more detailed instructions and an opportunity to learn something new, I’ll also provide a step-by-step guide using Excel’s Power Query feature. There are various methods to gather the data, but many Excel users are unfamiliar with Power Query. I suggest giving it a try, as it quickly streamlines data collection with a short learning curve. Plus, using Power Query, you can easily update source data for instant updates.
Analysis Steps – High Level
To perform an analysis, here are the high-level steps to follow:
Get a Usage report from Autodesk’s Management portal, selecting the option that reports daily usage for users over the entire last year.
Open the report in Excel, remove unwanted columns and keep only the user’s name/email, product, date of usage.
In another tab, create a Rate Sheet using the data from Autodesk’s website, including the product, number of tokens and daily cost.
In the Rate Sheet tab, search and replace extra data in the daily cost column to leave only the dollar amount.
In the Usage tab, add two columns for the number of tokens and cost.
Use VLOOKUP to find the product in the Rate Sheet and import the related data into these columns.
Create a Pivot table and adjust the data fields to display total cost for each user.
Compare the “theoretical” Flex cost with the cost of a full license for easy evaluation.
That’s it. You can ow see which users are “Cheaper” under Flex than the cost of a dedicated named license.
Analysis Step – Detailed w/Excel Power Query
If you want to learn Excel’s PowerQuery or have a more detailed explanation, this section is for you…
Step 1
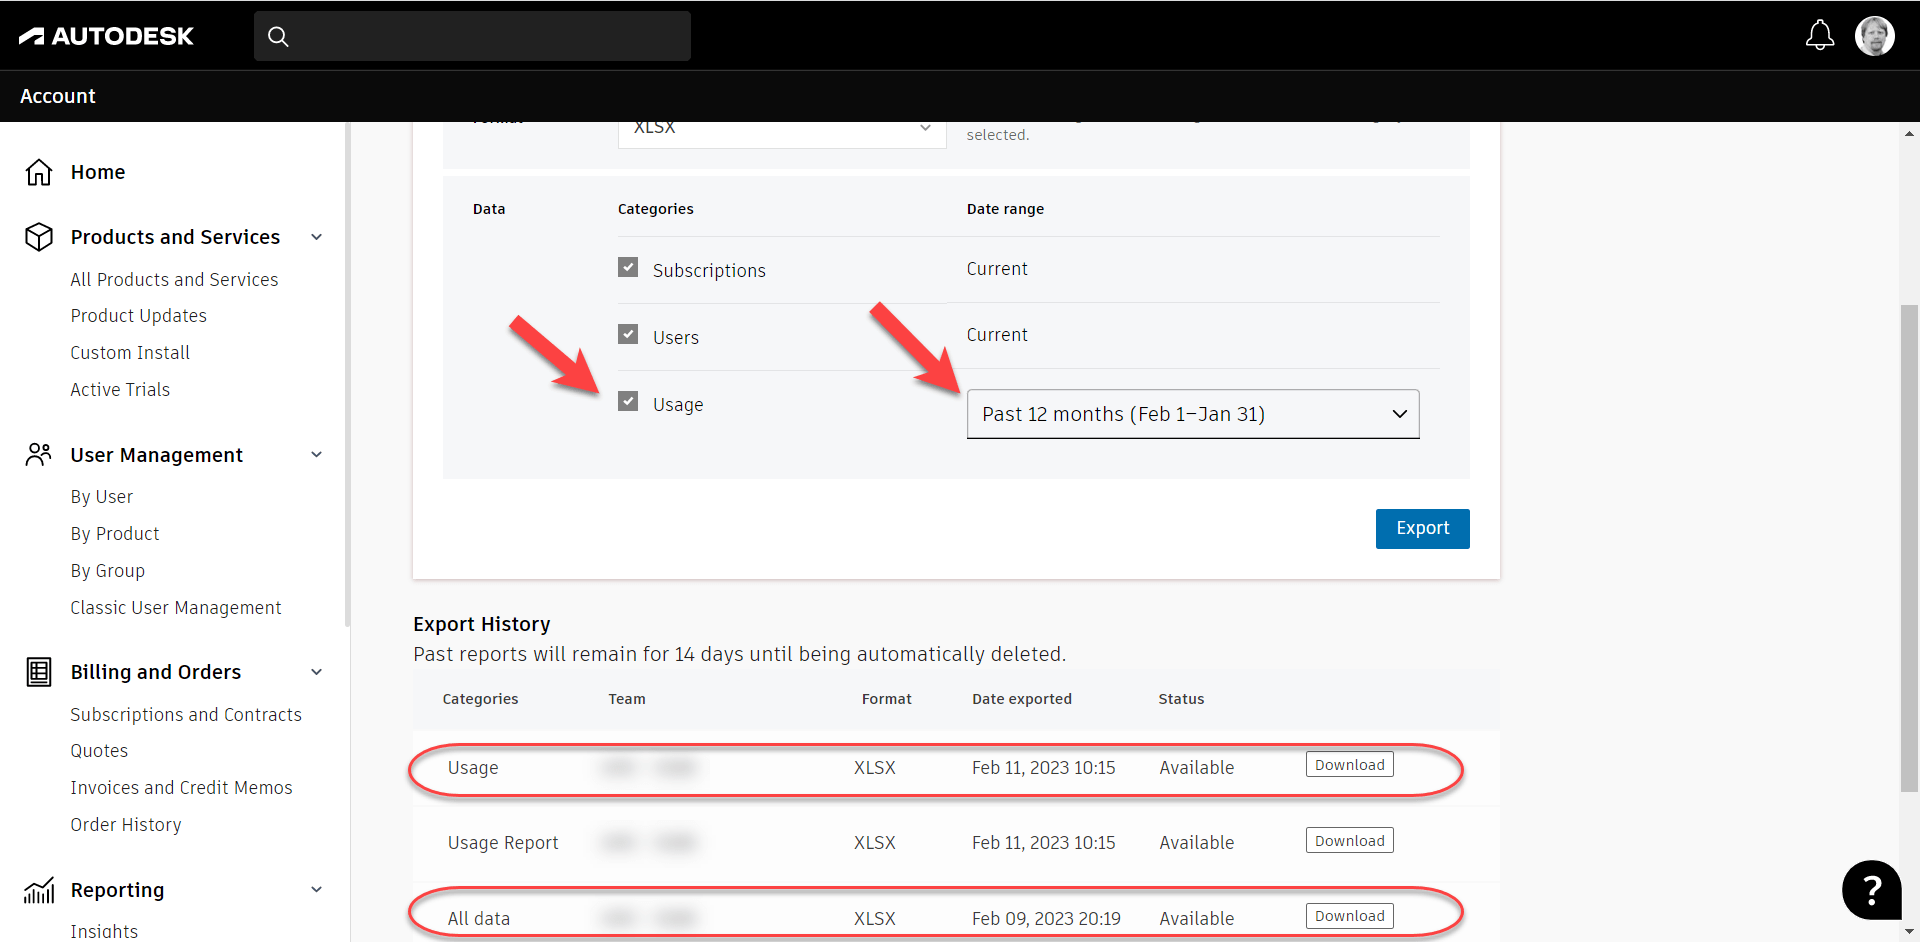
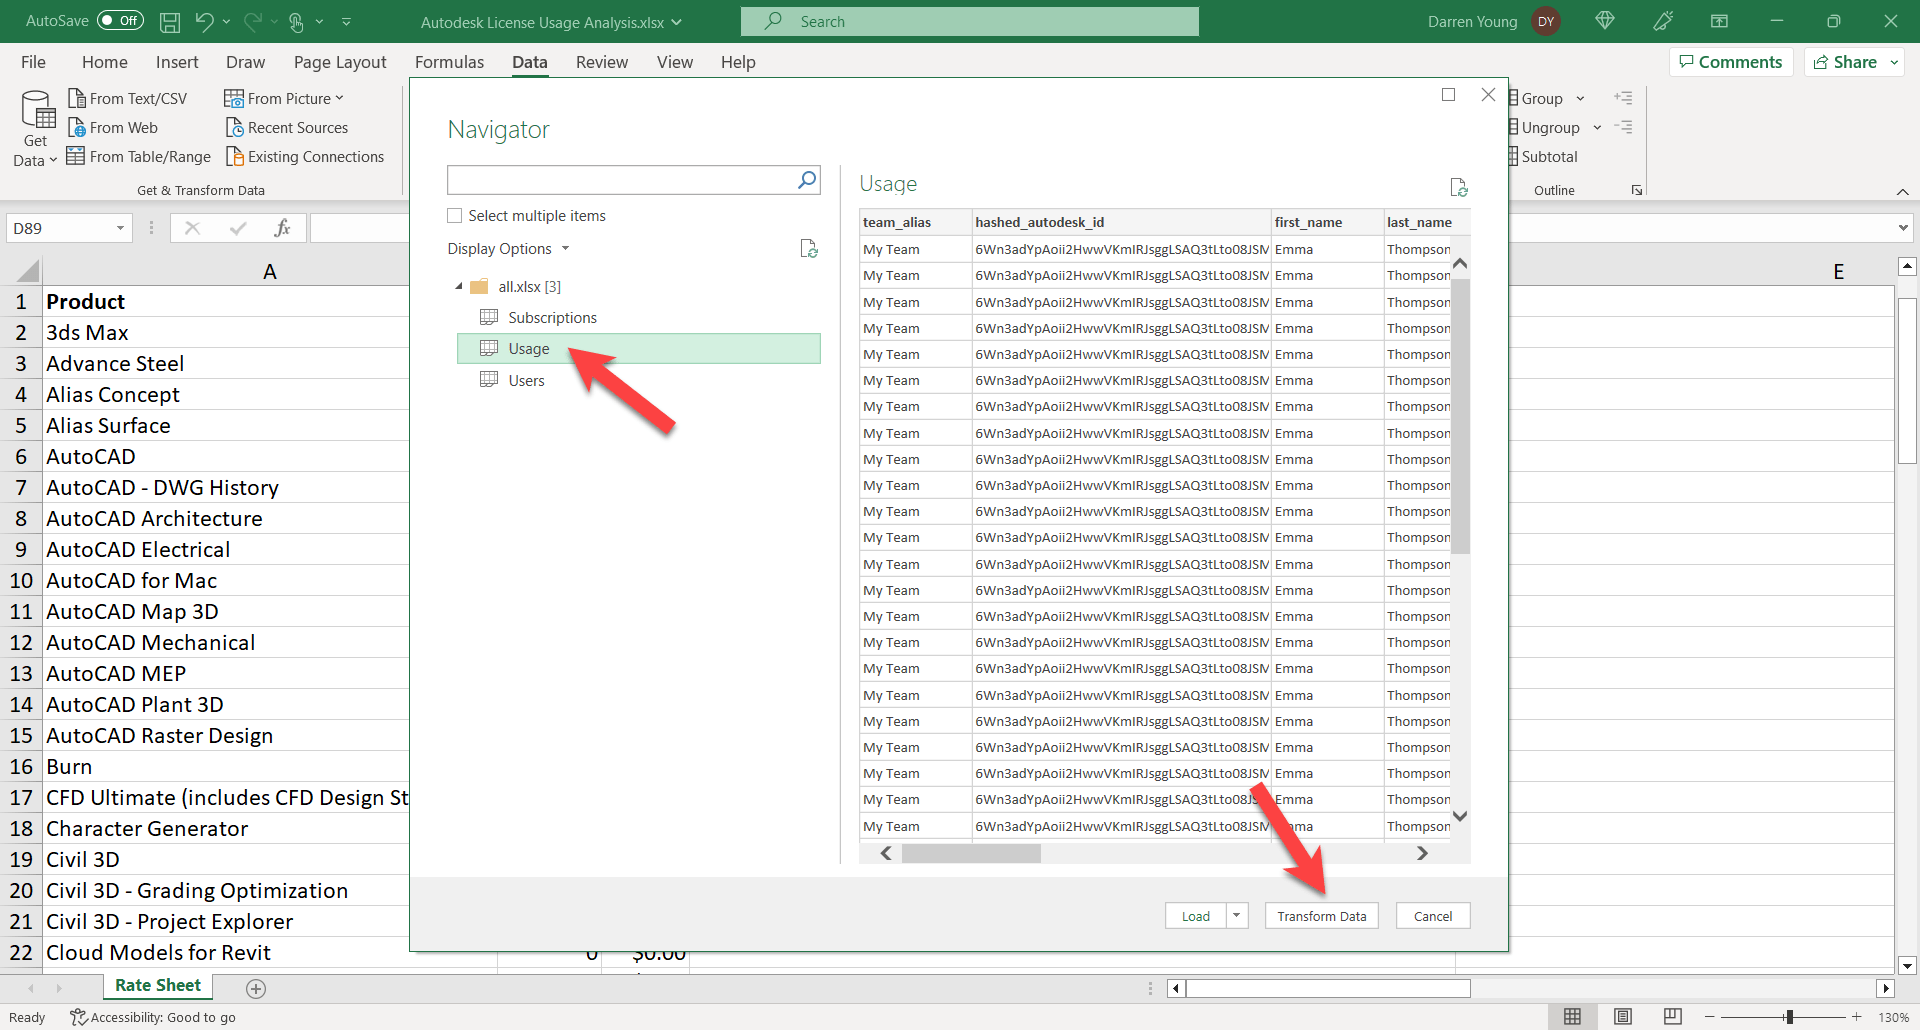
Go to your Autodesk Account Management portal. https://manage.autodesk.com Here you’ll see Usage Reporting (A) if you’re an Account Admin. You’ll want to change the duration for the full year (C) and make sure you’re looking at the correct Team (B). This then displays high level stats and more detailed drill down information further below. Click the Export button (D) to export usage data.
Step 2
When you get to the Export page, you’ll see there’s a report being generated automatically. This is the with “Usage Report” in the category. You do NOT want this report. This is a summary report. Instead, you’ll want to use the options at the top of the page and generate a ‘Usage’ report. If you select all options, you’re report will say “All” although for this purpose, those other data points aren’t needed.
Download this report when it’s finished generating.
Note, you can get to this Export page from the “By Product” section too.
Step 3
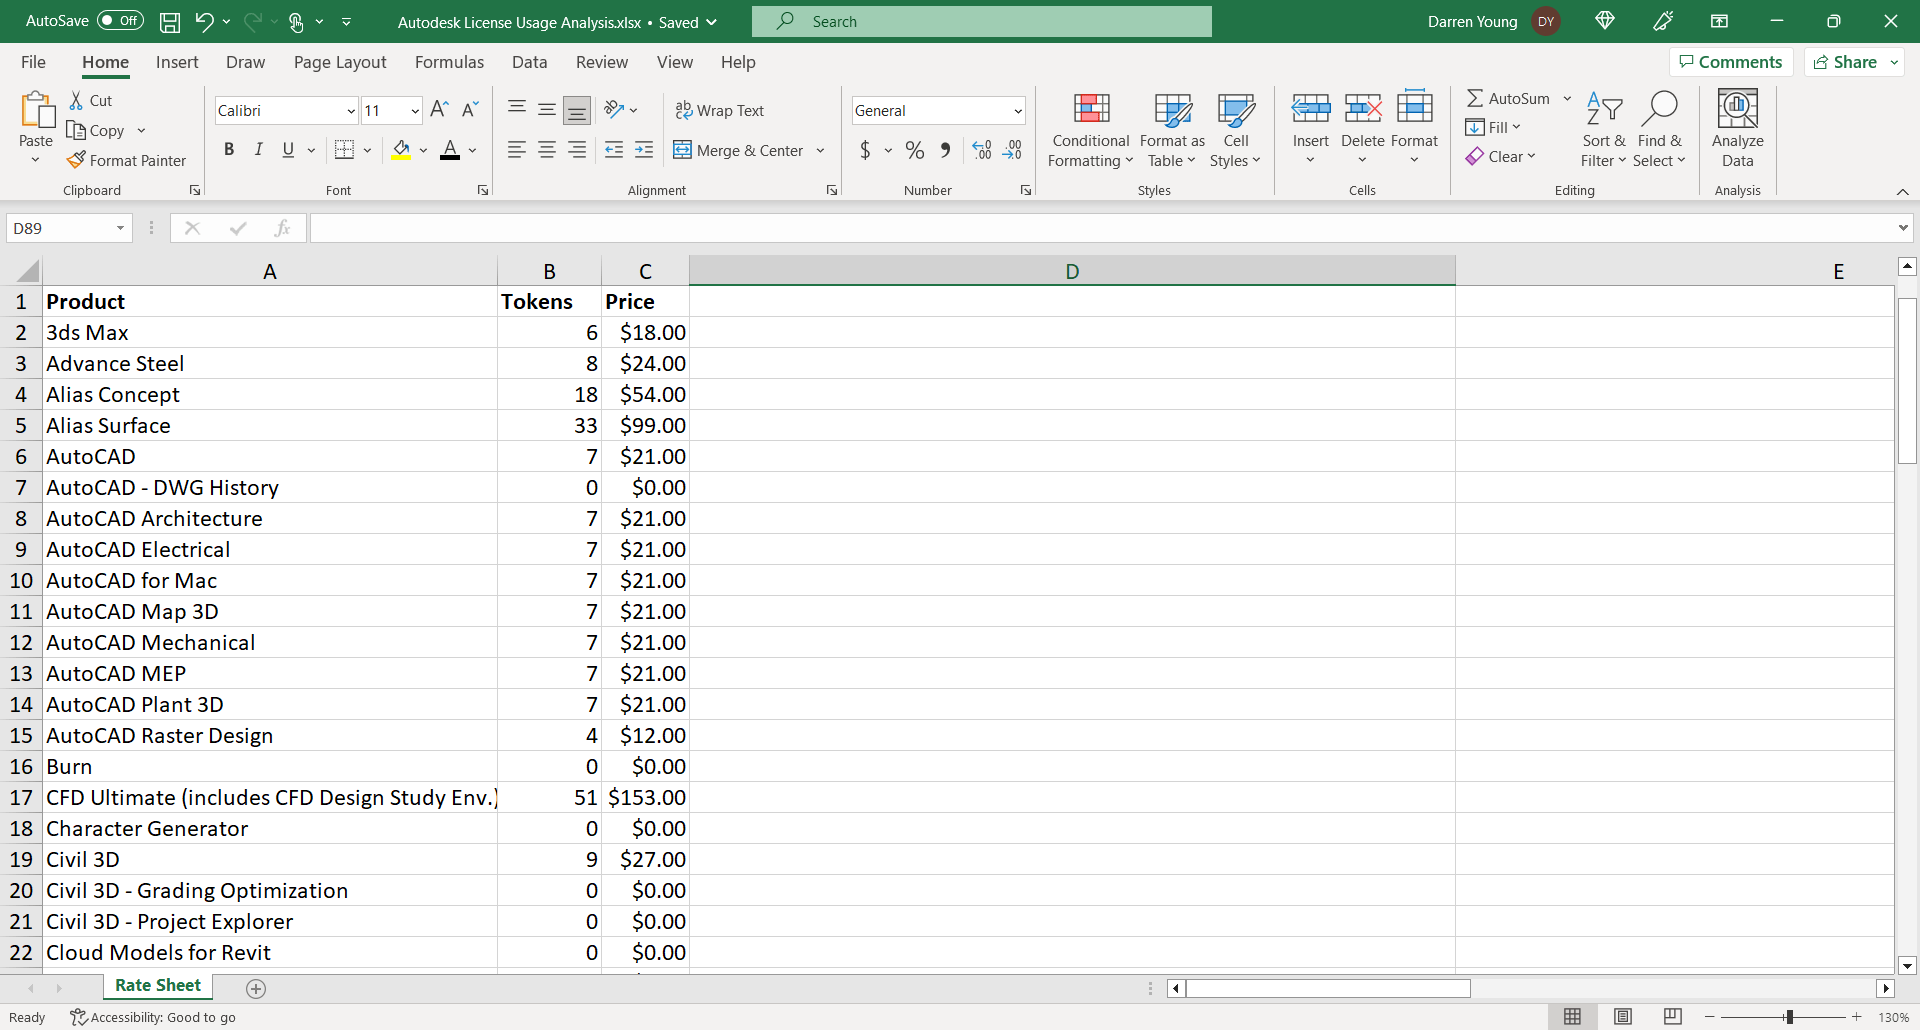
Start Excel and create a new Spreadsheet in the same place you downloaded your usage report. In the new spreadsheet, create a Token Rate sheet consisting of the product name, number of tokens and daily cost. You can copy and paste this from Autodesk’s site linked earlier. Clean up the data and rename the spreadsheet tab something meaningful. When you’re done, it should look something like this.
Step 4
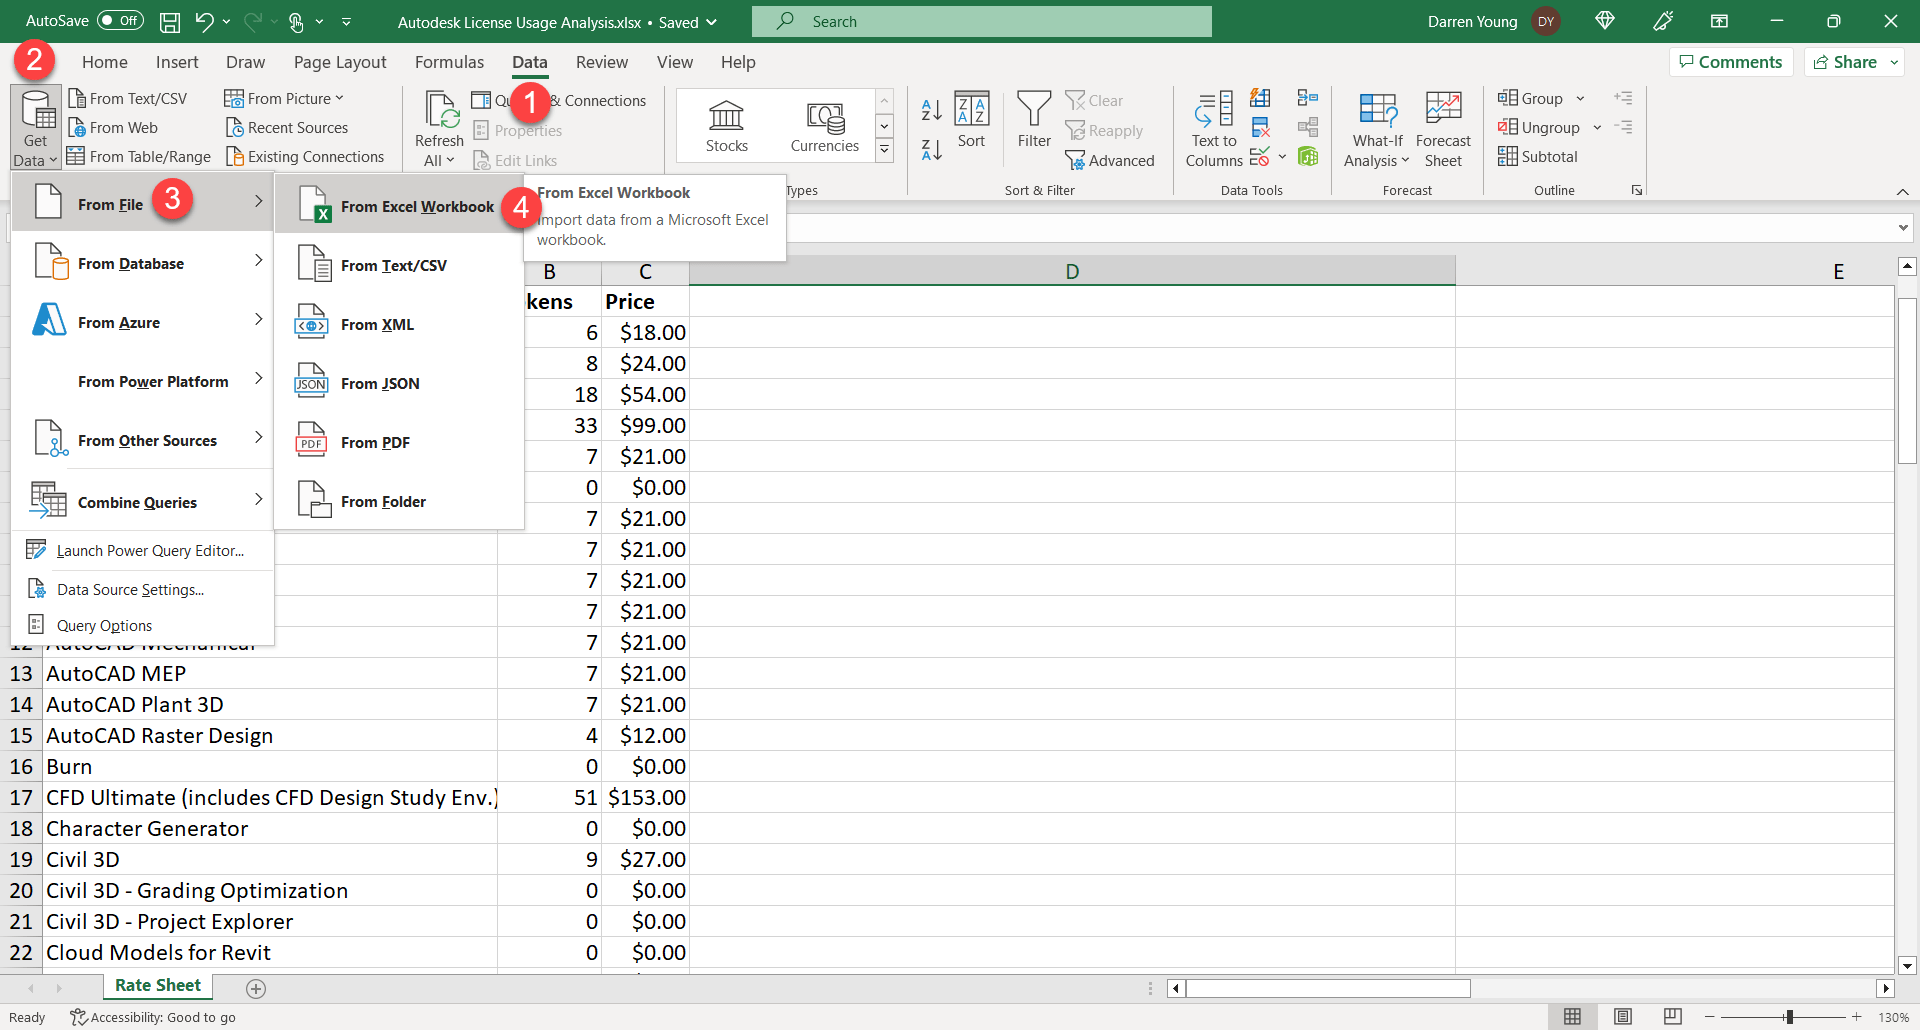
Now we’re going to use Excel’s Power Query functionality to merge in our exported data. The benefit of doing it this way is that you can replace your export later with new data and not have to do all these steps. It’s merely referenced into the Spreadsheet you’re working in. Select Data (1), Get Data (2), From File (3) then From Excel Workbook (4).
Step 5
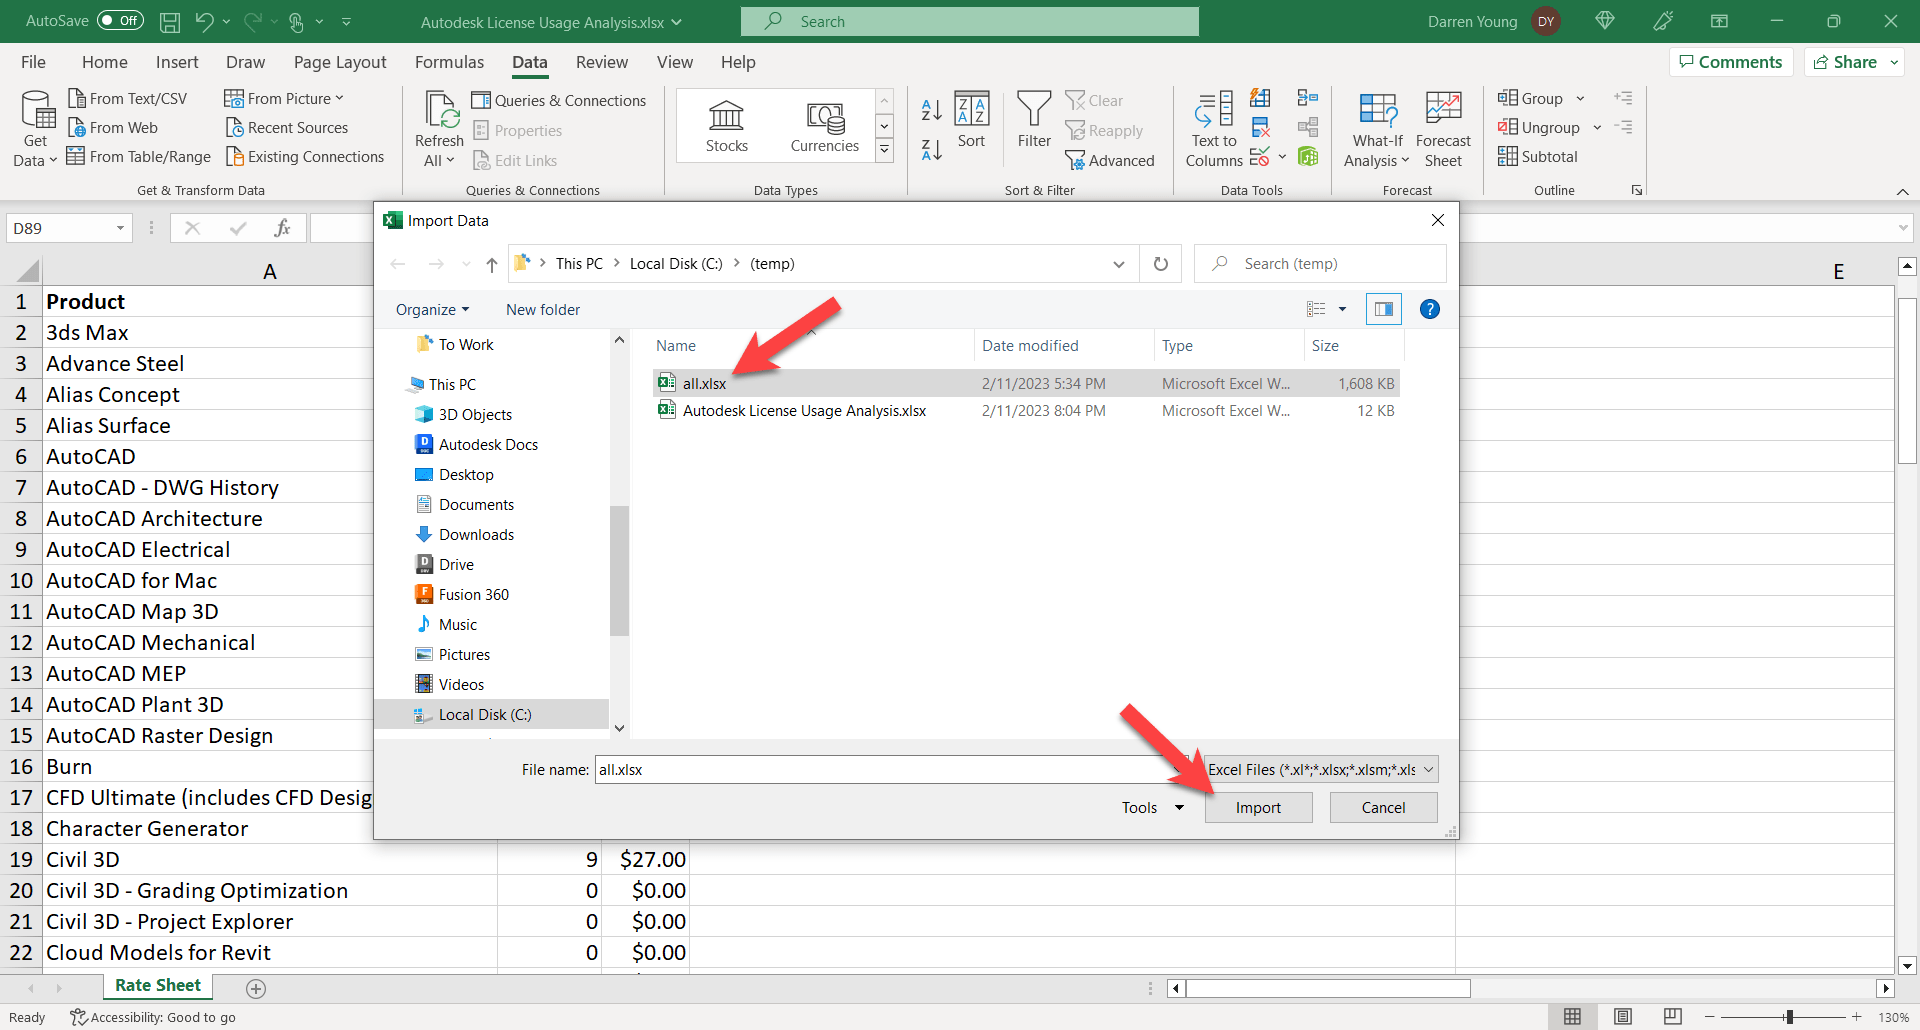
Select your usage report that you downloaded from Autodesk (1) then click Import.
Step 6
Next, Excel will examine your spreadsheet for data sources. Select the “Usage” Tab (not Users) and click “Transform Data“.
Step 7
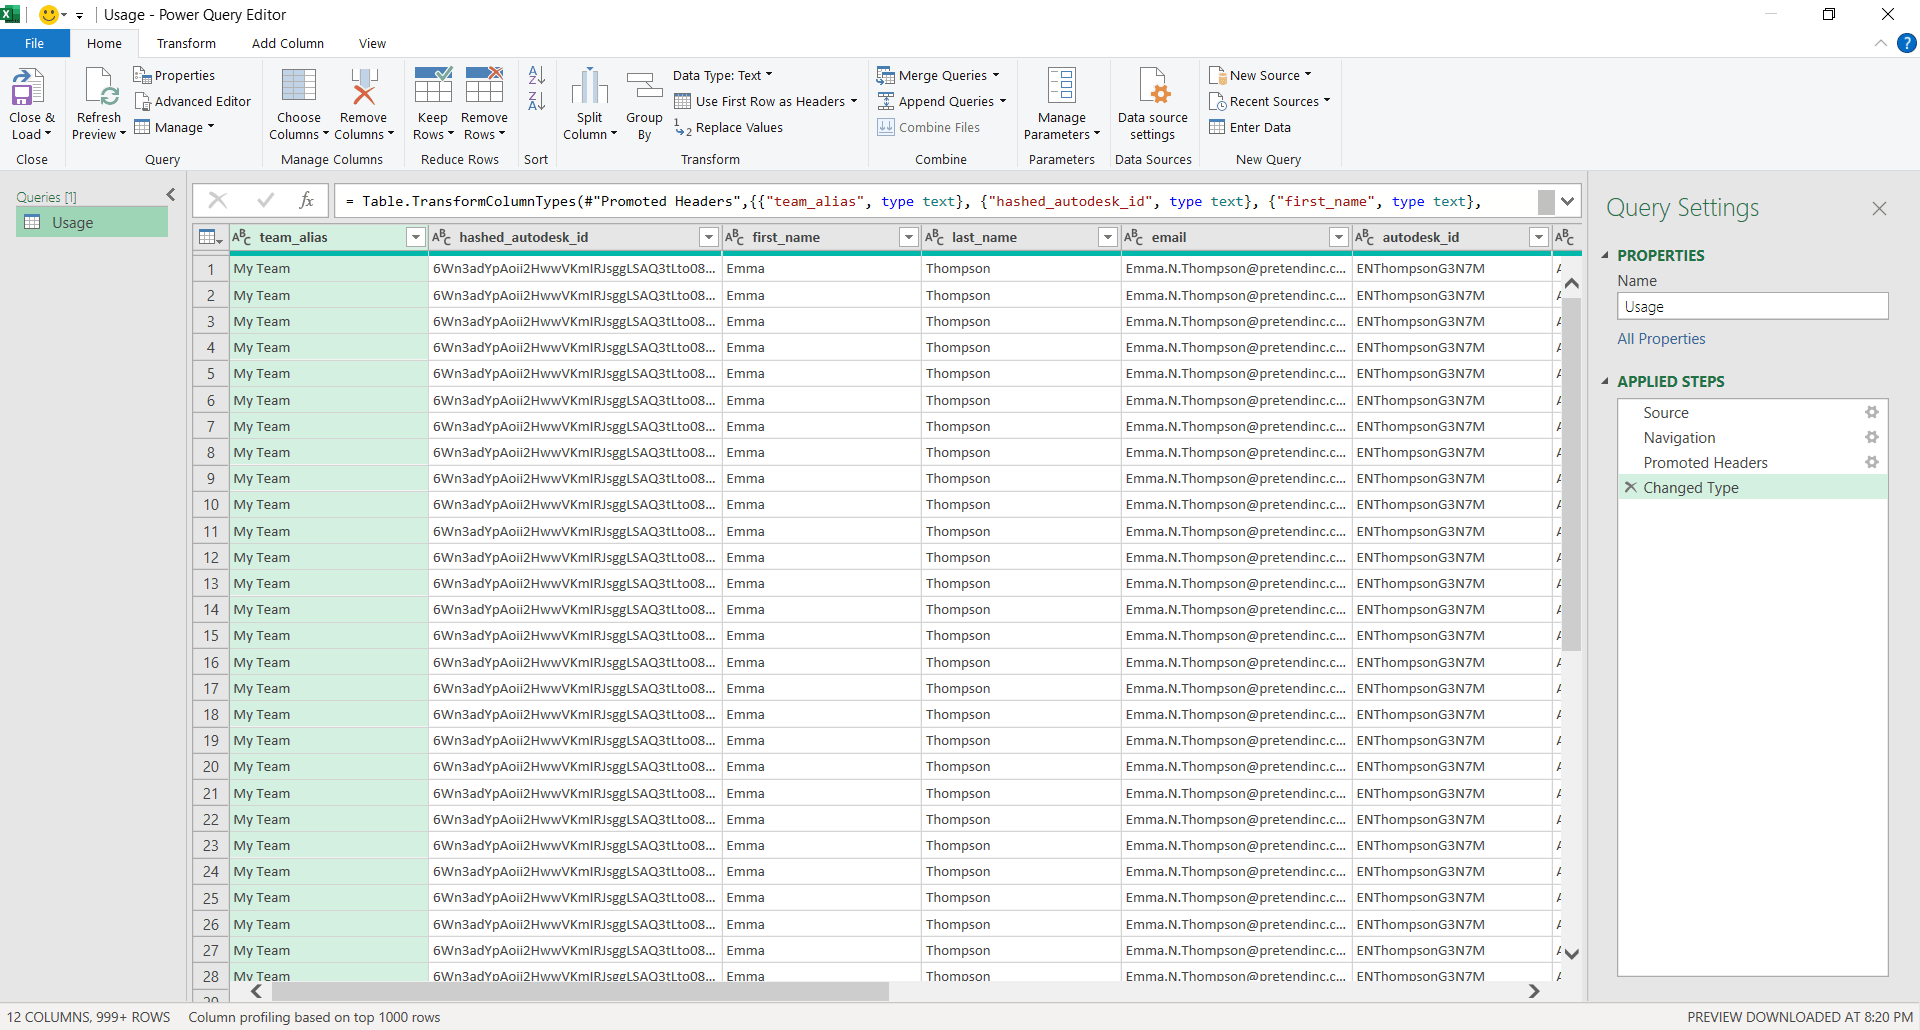
This brings up the Power Query Editor. Here’s where Power Query makes it very easy to clean and scrub your data step by step so you don’t have to alter the source data. This means you an update your source data anytime, and Power Query will perform the same cleaning steps.
Step 8
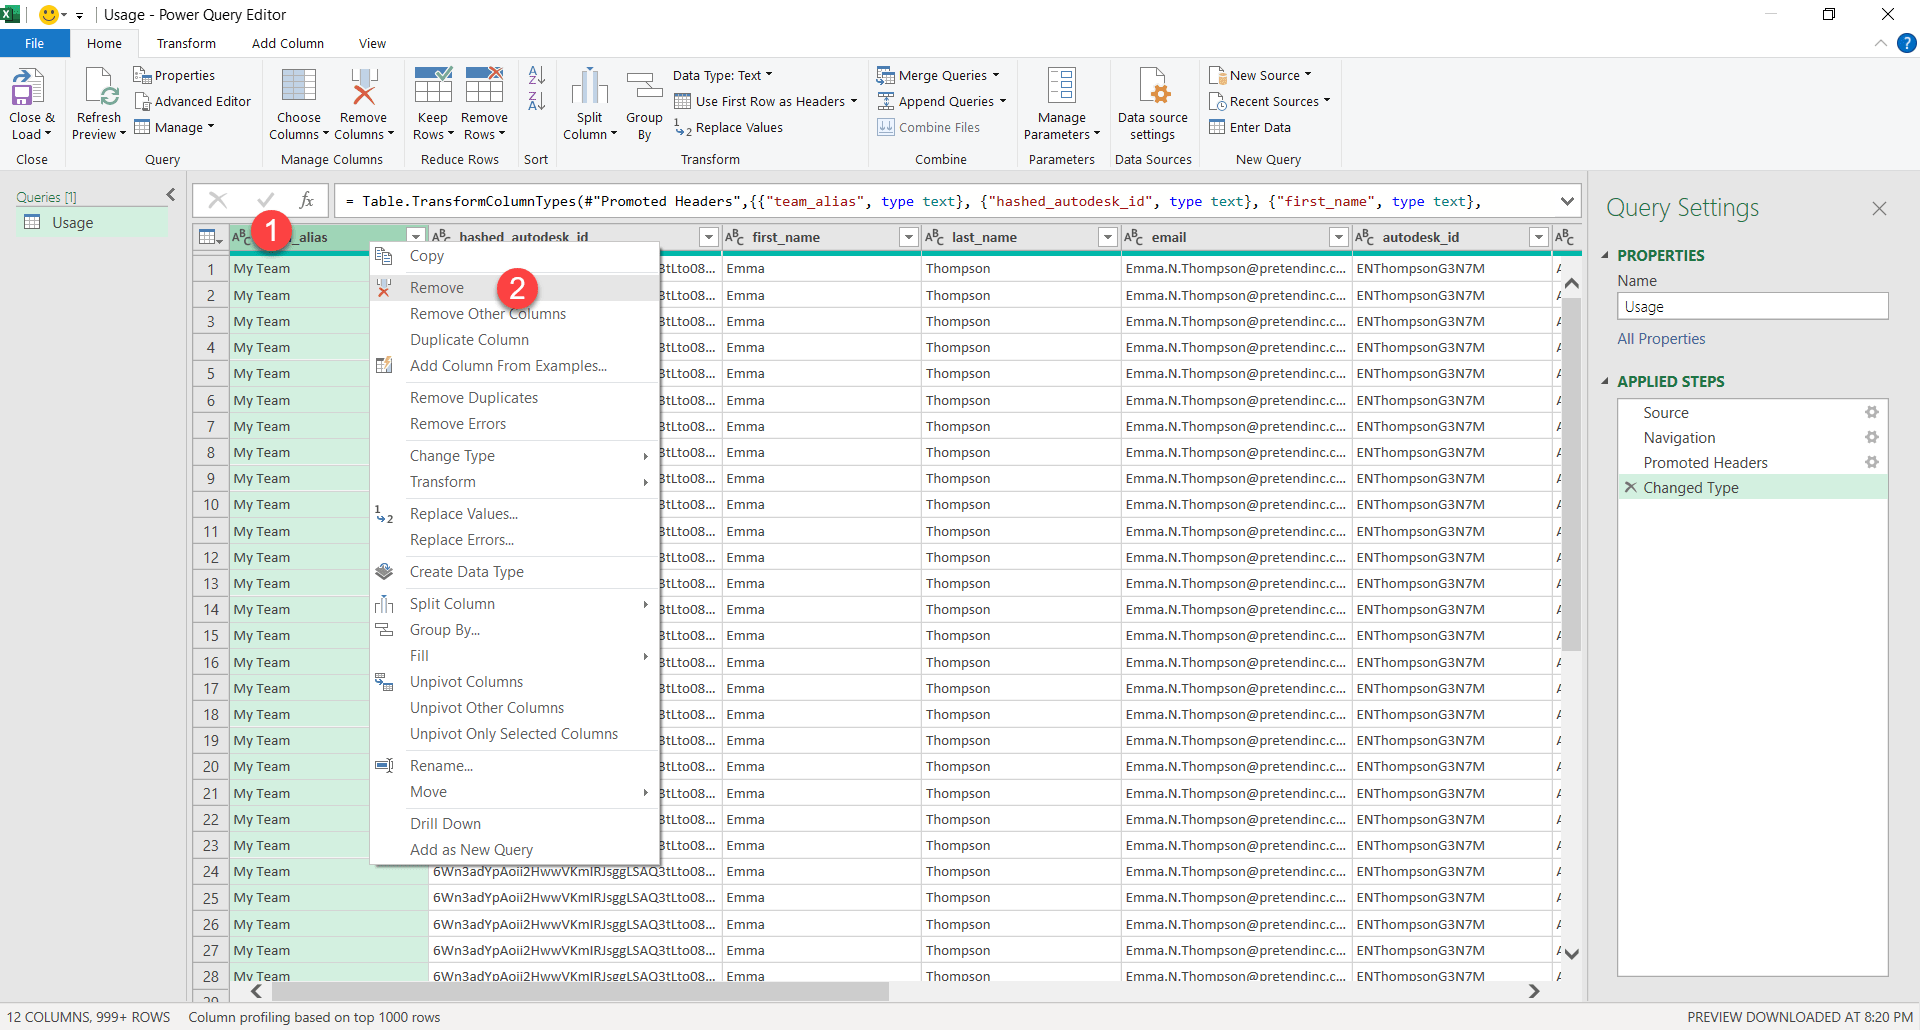
Next, we’ll start removing columns we don’t want. Right-Click on the header of the first column and select Remove to remove that column. You’ll notice on the list of steps on the right, there’s another entry added.
Step 9
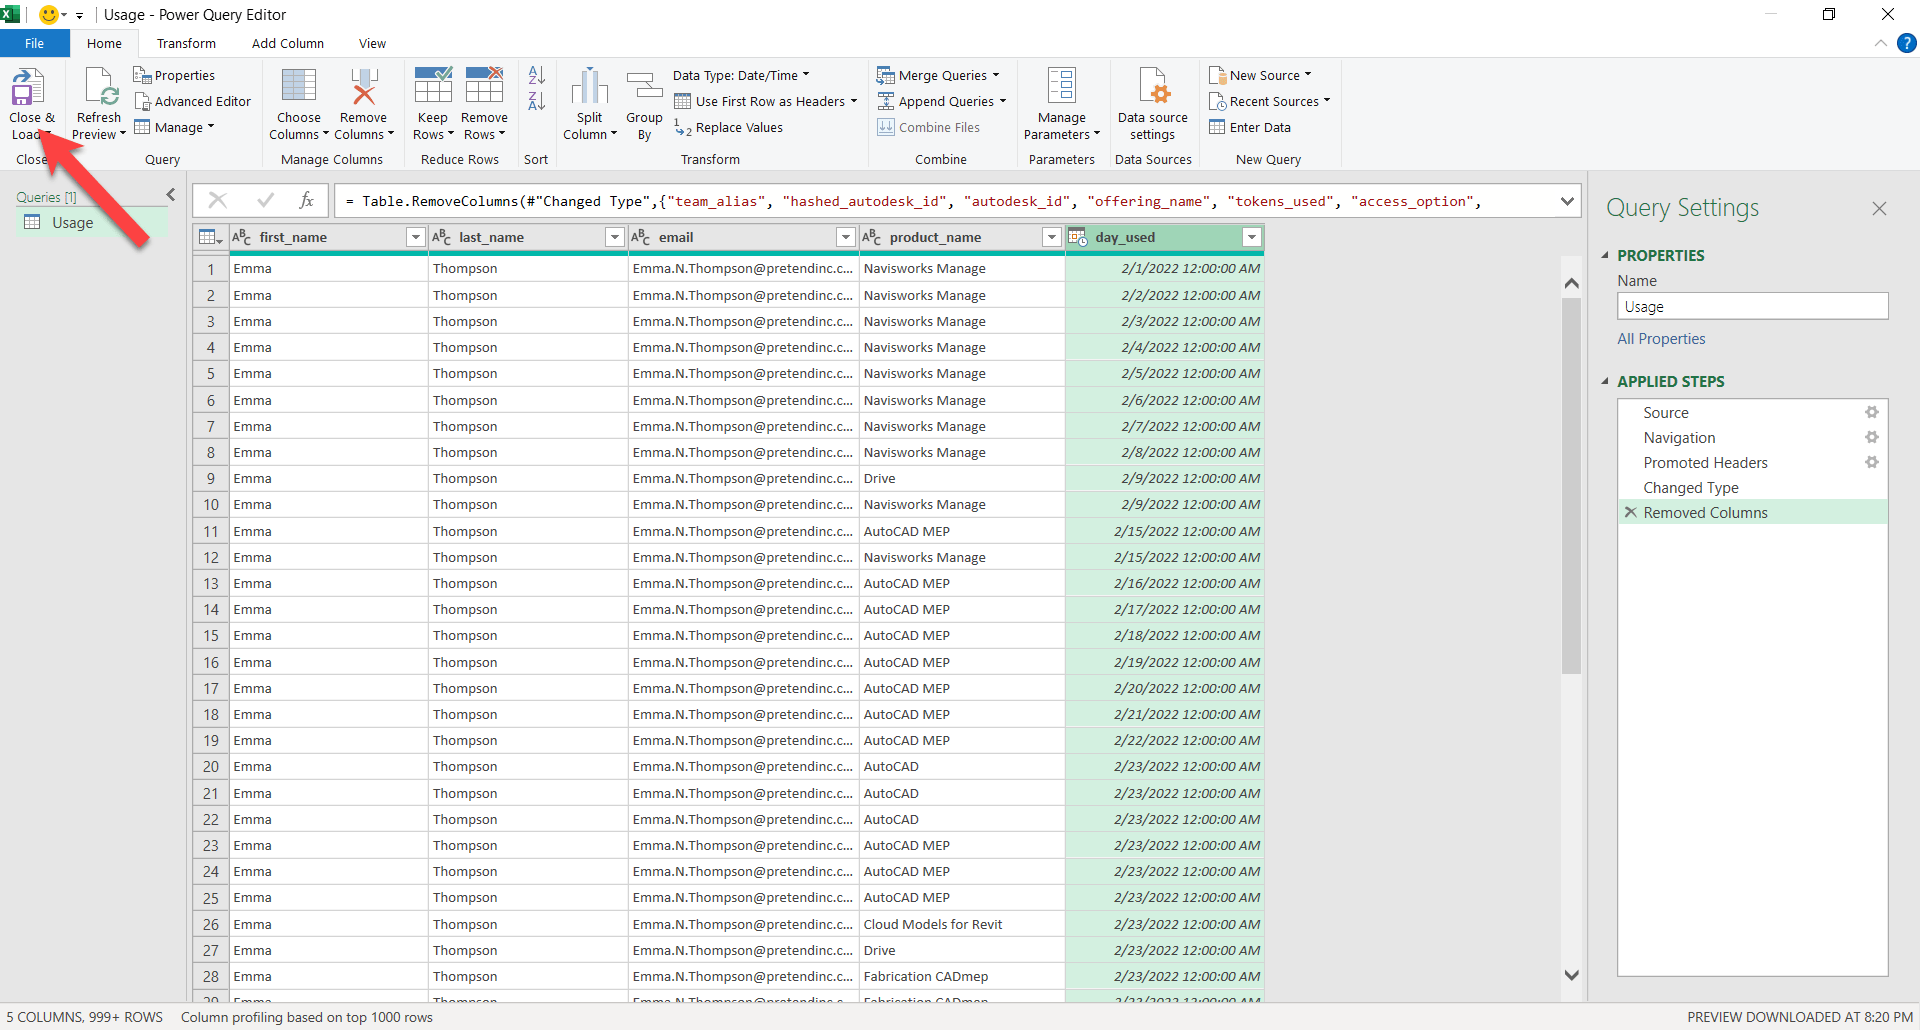
When your done, you should have only the following columns remaining…“first_name”, “last_name”, “email”, “product_name” and “day_used”. We could go further, but for now, let’s see what this looks like. Click Close & Load to import this cleaned up data into your Excel Spreadsheet.
Step 10
Excel closes the Power Query editor and loads your cleaned up data into your spreadsheet. It’s not actually “in” your spreadsheet, it’s referenced from the usage report you downloaded from Autodesk and Power Query cleaned and filtered it before displaying it. You could replace the usage report 2 months later with newer data and this spreadsheet can then be refreshed to show you the latest information.
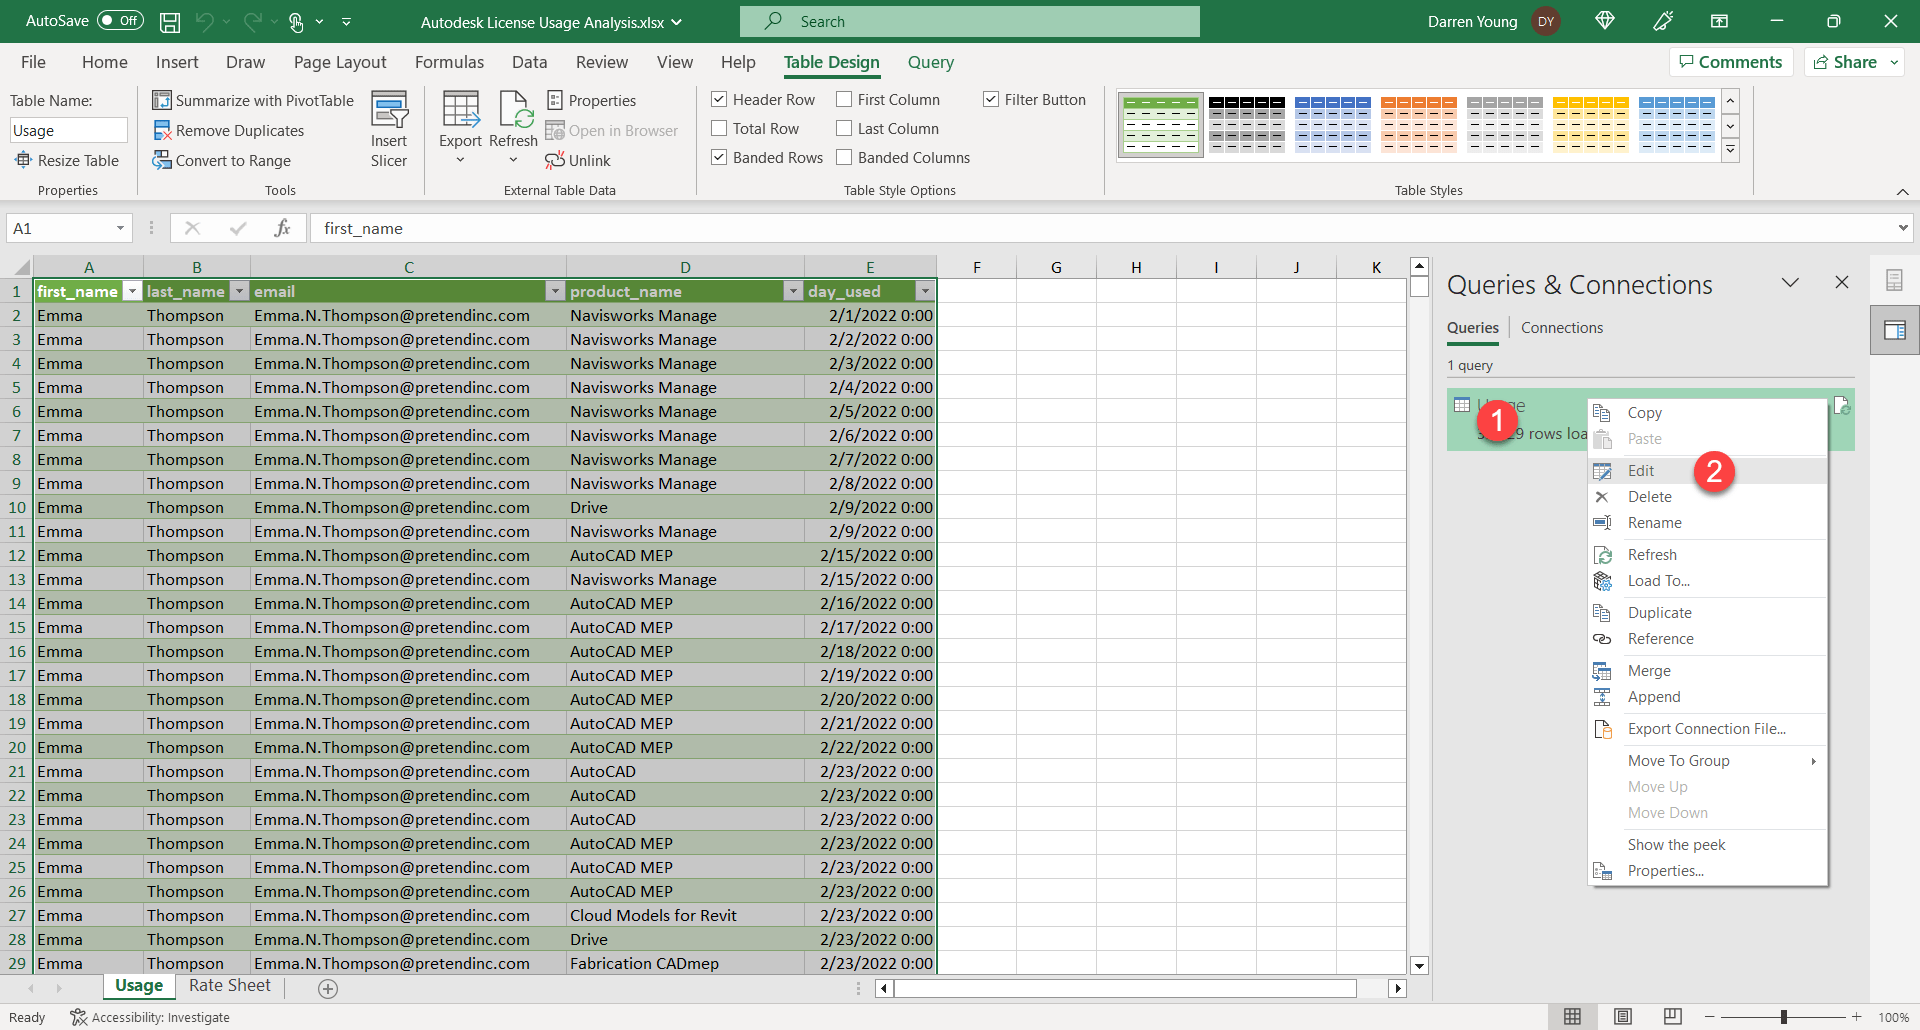
Next, we’ll add a few more columns. To get back to the Power Query Editor, Right-Click on the Connection in the palette on the right and select Edit.
Step 11
The first column we’re going to add is one that concatenates the “first_name”, “last_name” and “email” fields together. This isn’t really needed, but I like to see both the name and email. This will help combine them in the Pivot table we create later. The name is helpful to know who the user is, but Autodesk accounts done times it’s easier to use the email. That’s why I use both. Especially if your company’s email format only includes the first letter of a name.
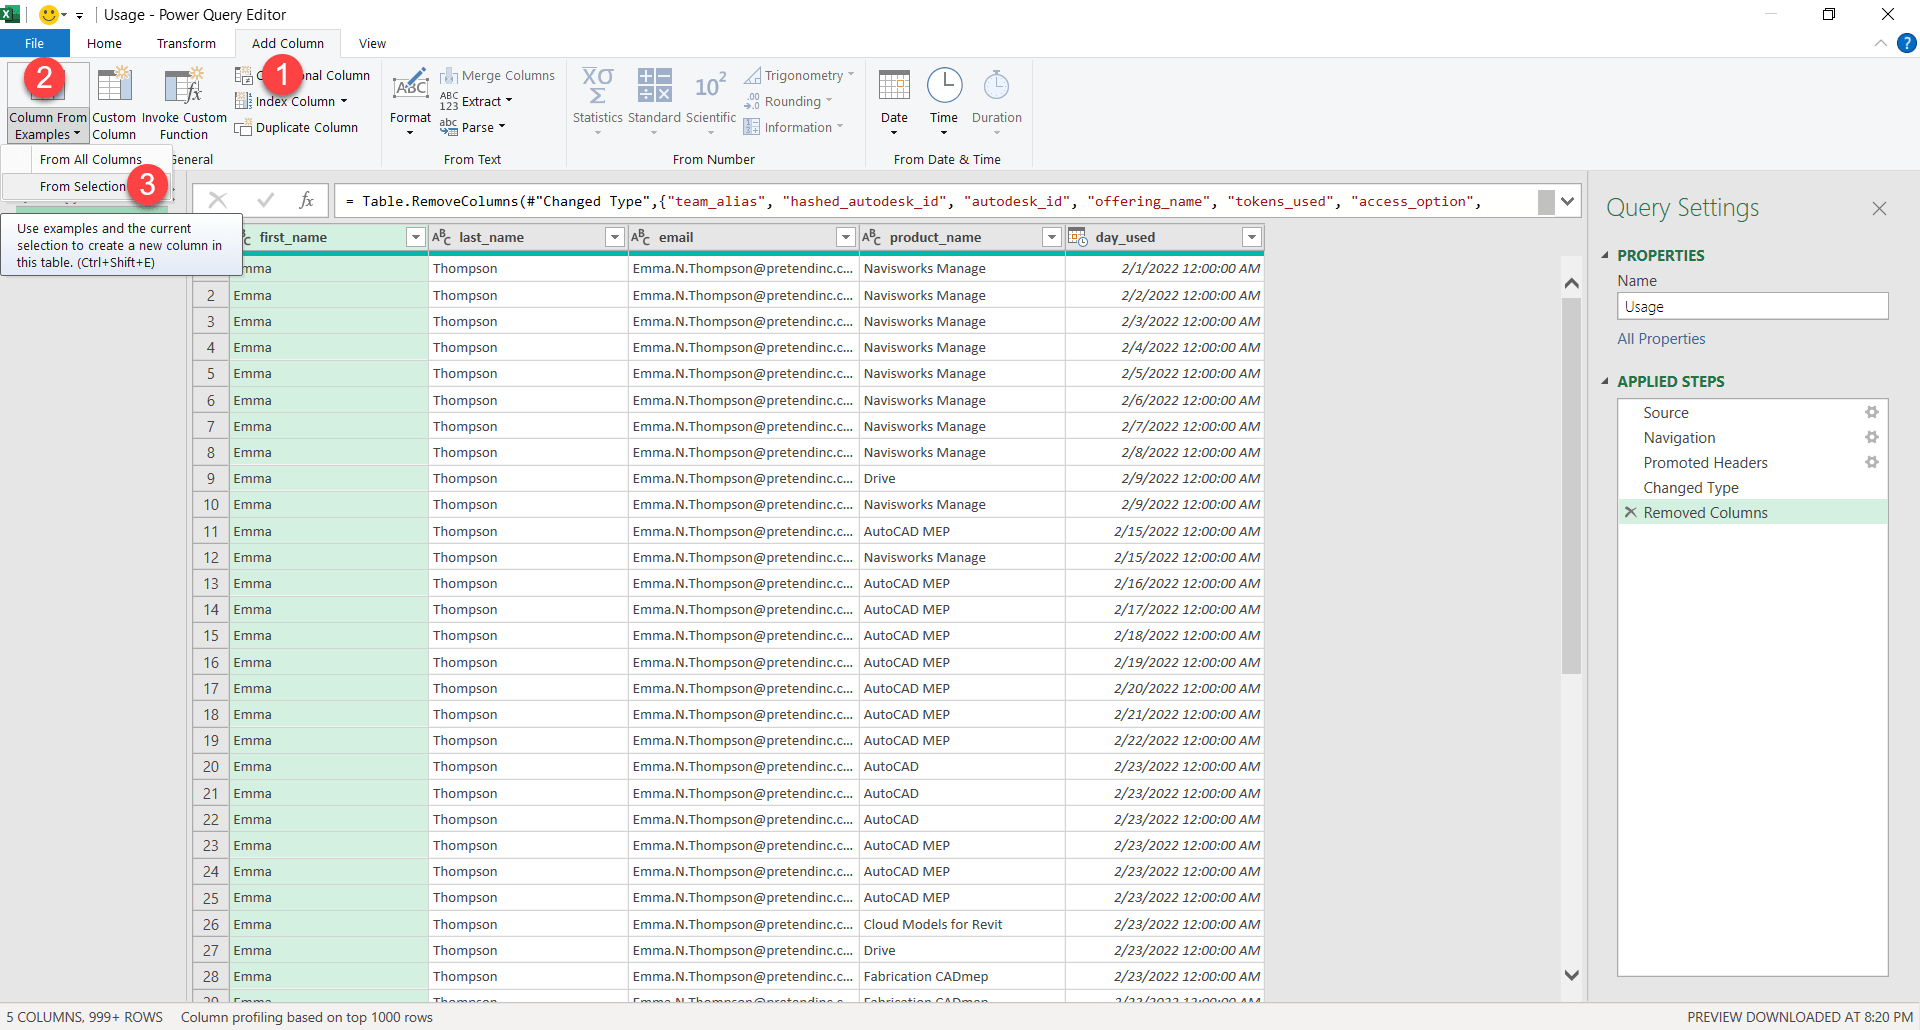
To start this process, select Add Column, Column From Examples then From Selection.
Step 12
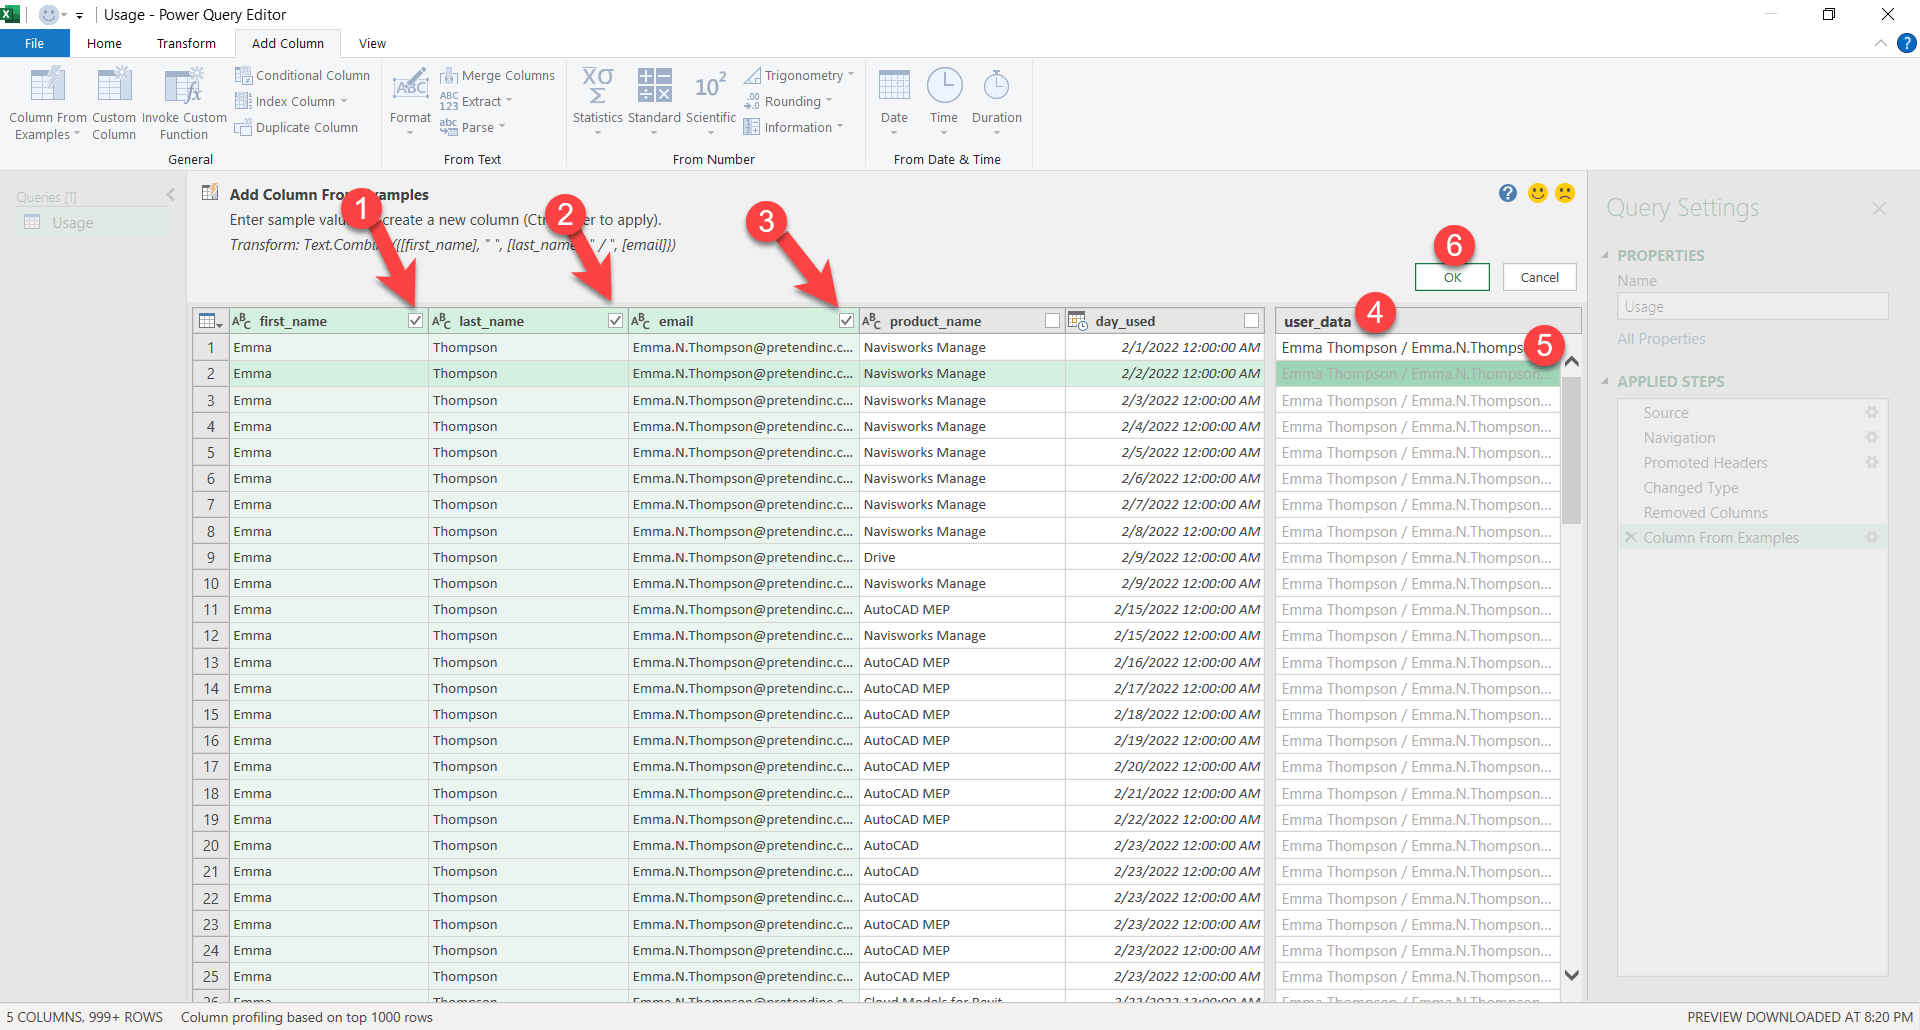
In this step, select the columns you want to combine. Here it’s “first_name” (1), “last_name” (2) and “email” (3). This tells Power Query which columns you’re going to pull from. Next, Double-Click on the header of the new column on the right (4) and edit the column’s name to “user_data”. Next, Double-Click the first open cell below that header (5) and start typing an example of how you want the data to look. Here, I type “Emma Thompson / Emma.N.Thompson@pretendinc.com”. Power Query is looking at the columns I selected earlier and the example text I typed to determine which fields to combine along with any extra data like the space or slash I’m using for formatting. Next, press Control-Enter to fill the examples in the rest of the cells. Once complete, click Ok (6) to insert the new column.
Step 13
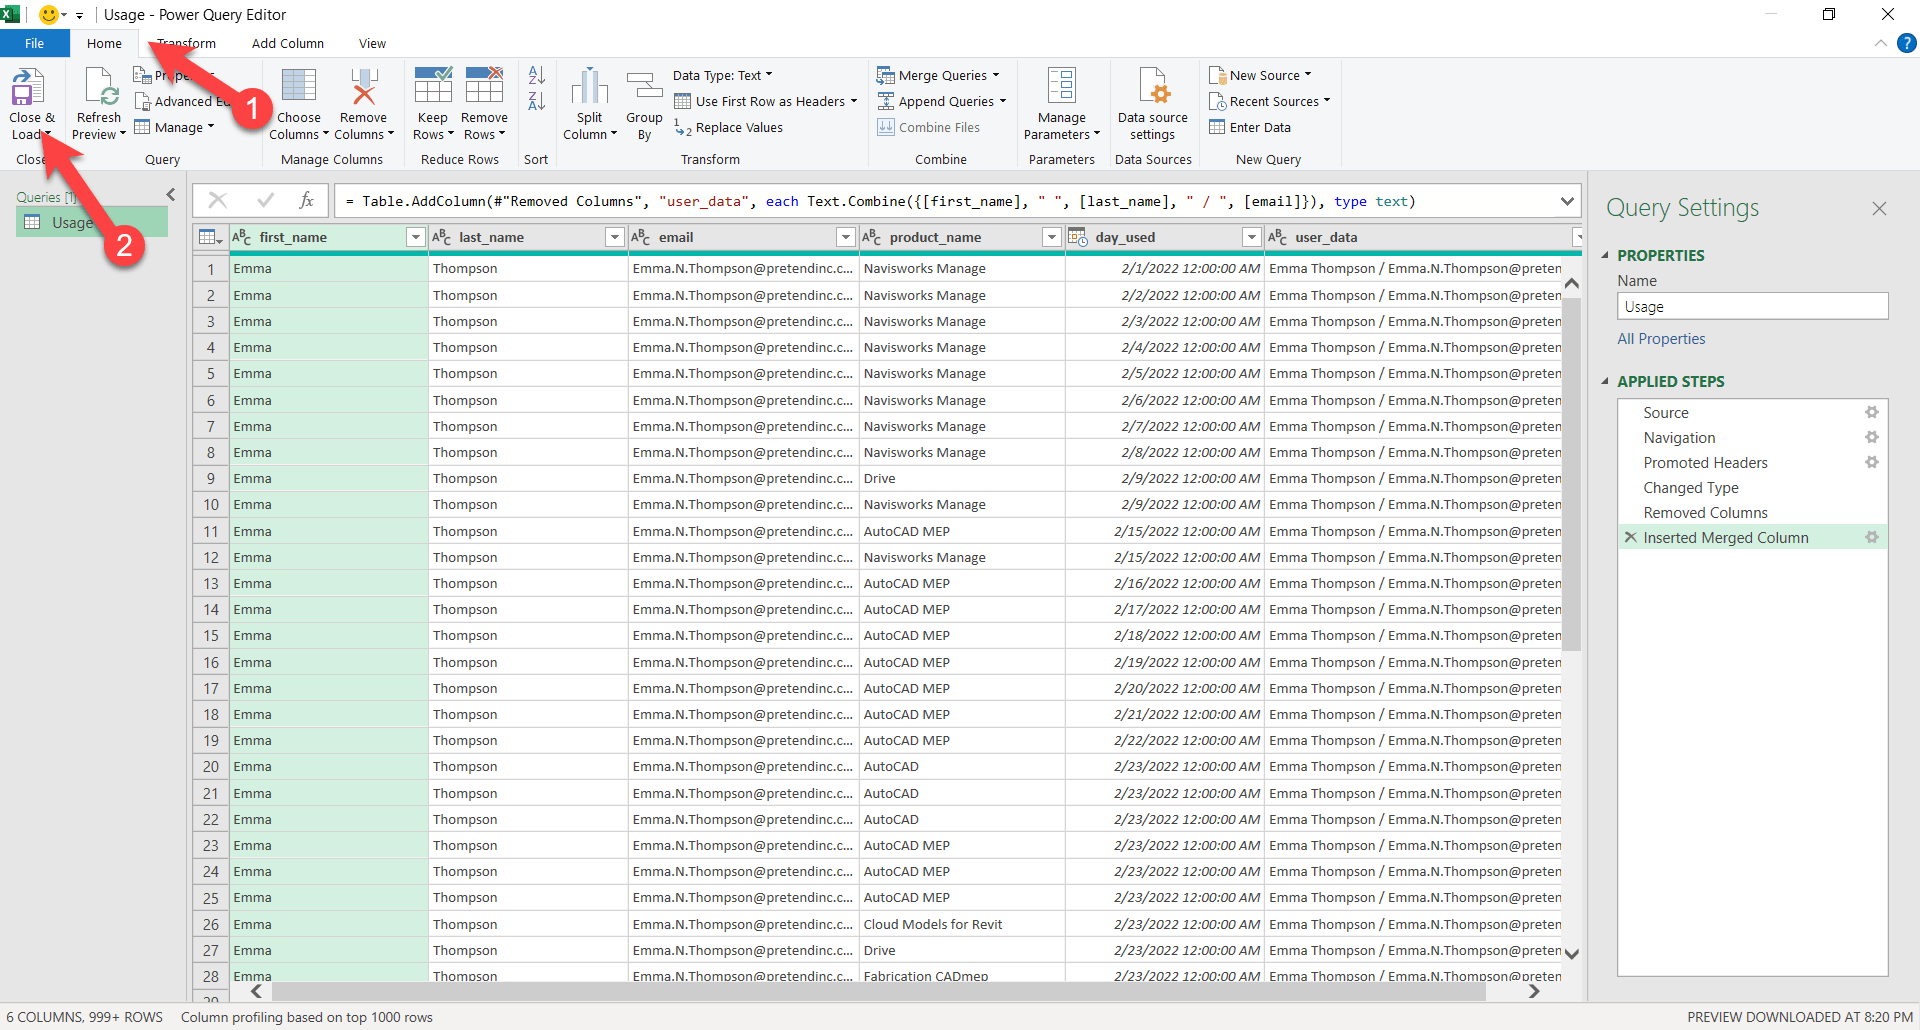
You’ll see the column added to the Power Query Editor. Next, let’s load that back into Excel. ClickHome then Close and Load to load this query into Excel.
Step 14
Now that you’re back in Excel, you can see the data column that was added. Your source data however is not altered. Next, we’ll need to create another query for our Rate Sheet tab. This is just raw data. It’s not intelligent so we’ll make a query of it to give us more power.
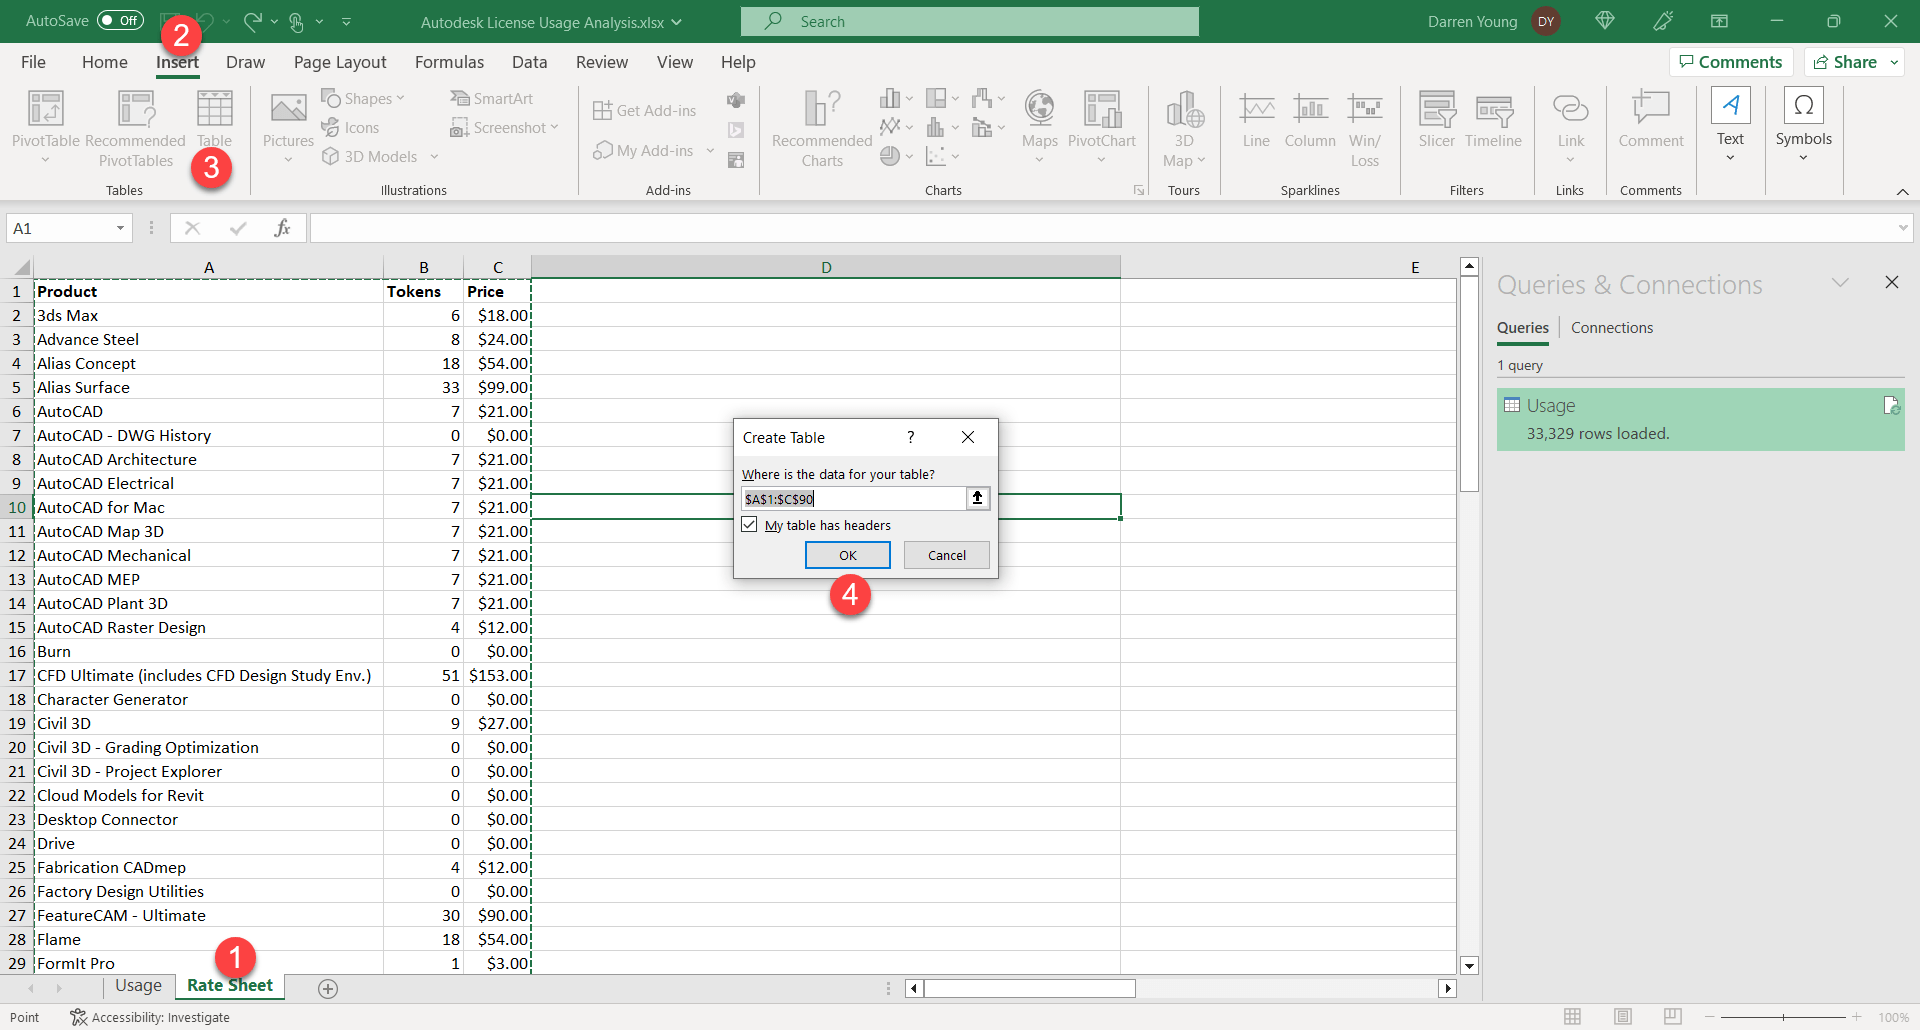
To do this, we’ll make it a Table so Power Query can more intelligently pull data from it. Select the Rate Sheet tab (1) in your spreadsheet. Next, Click Insert (2) then Table (3). Excel should find all the data in the sheet and automatically enter the range into the popup dialog when you can click OK,
Step 15
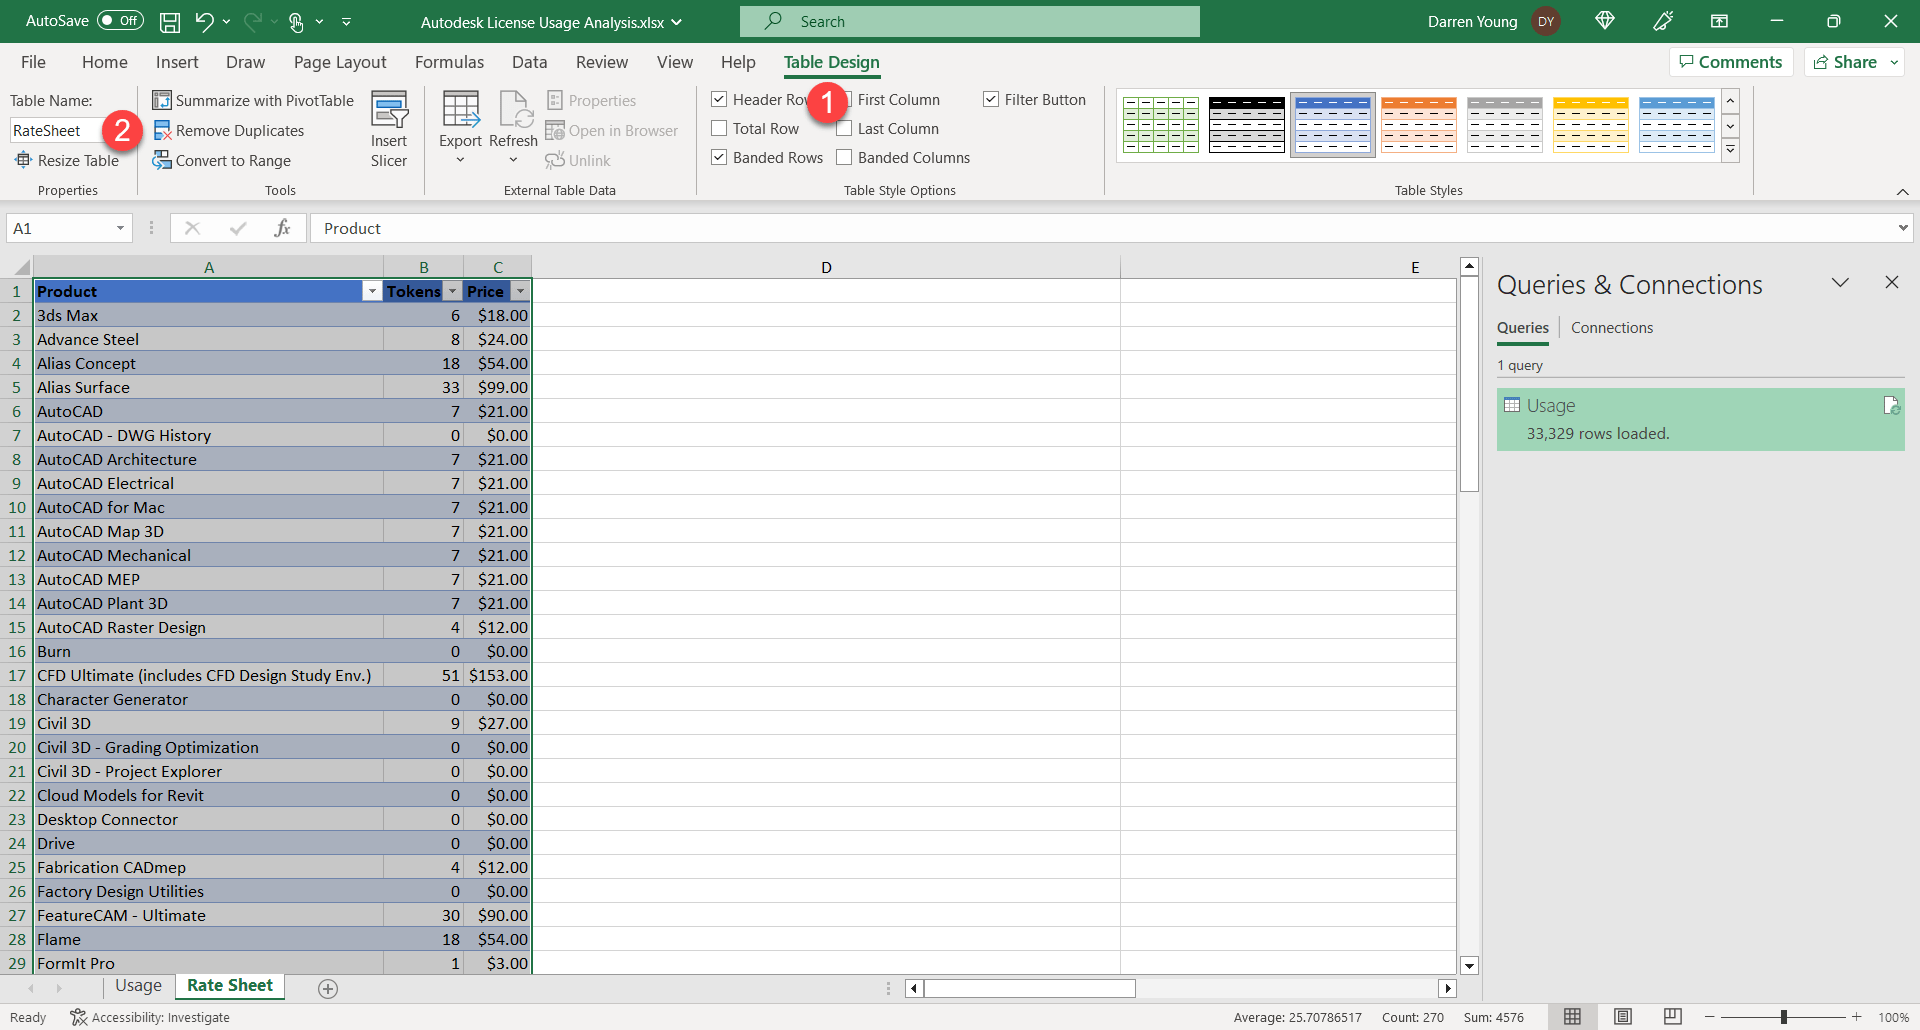
Excel turns your data into a Table which is a more intelligent object. From here, we’ll rename the table to something more intuitive. Click Table Design (1) then in the Table Name edit box, type “RateSheet”.
Step 16
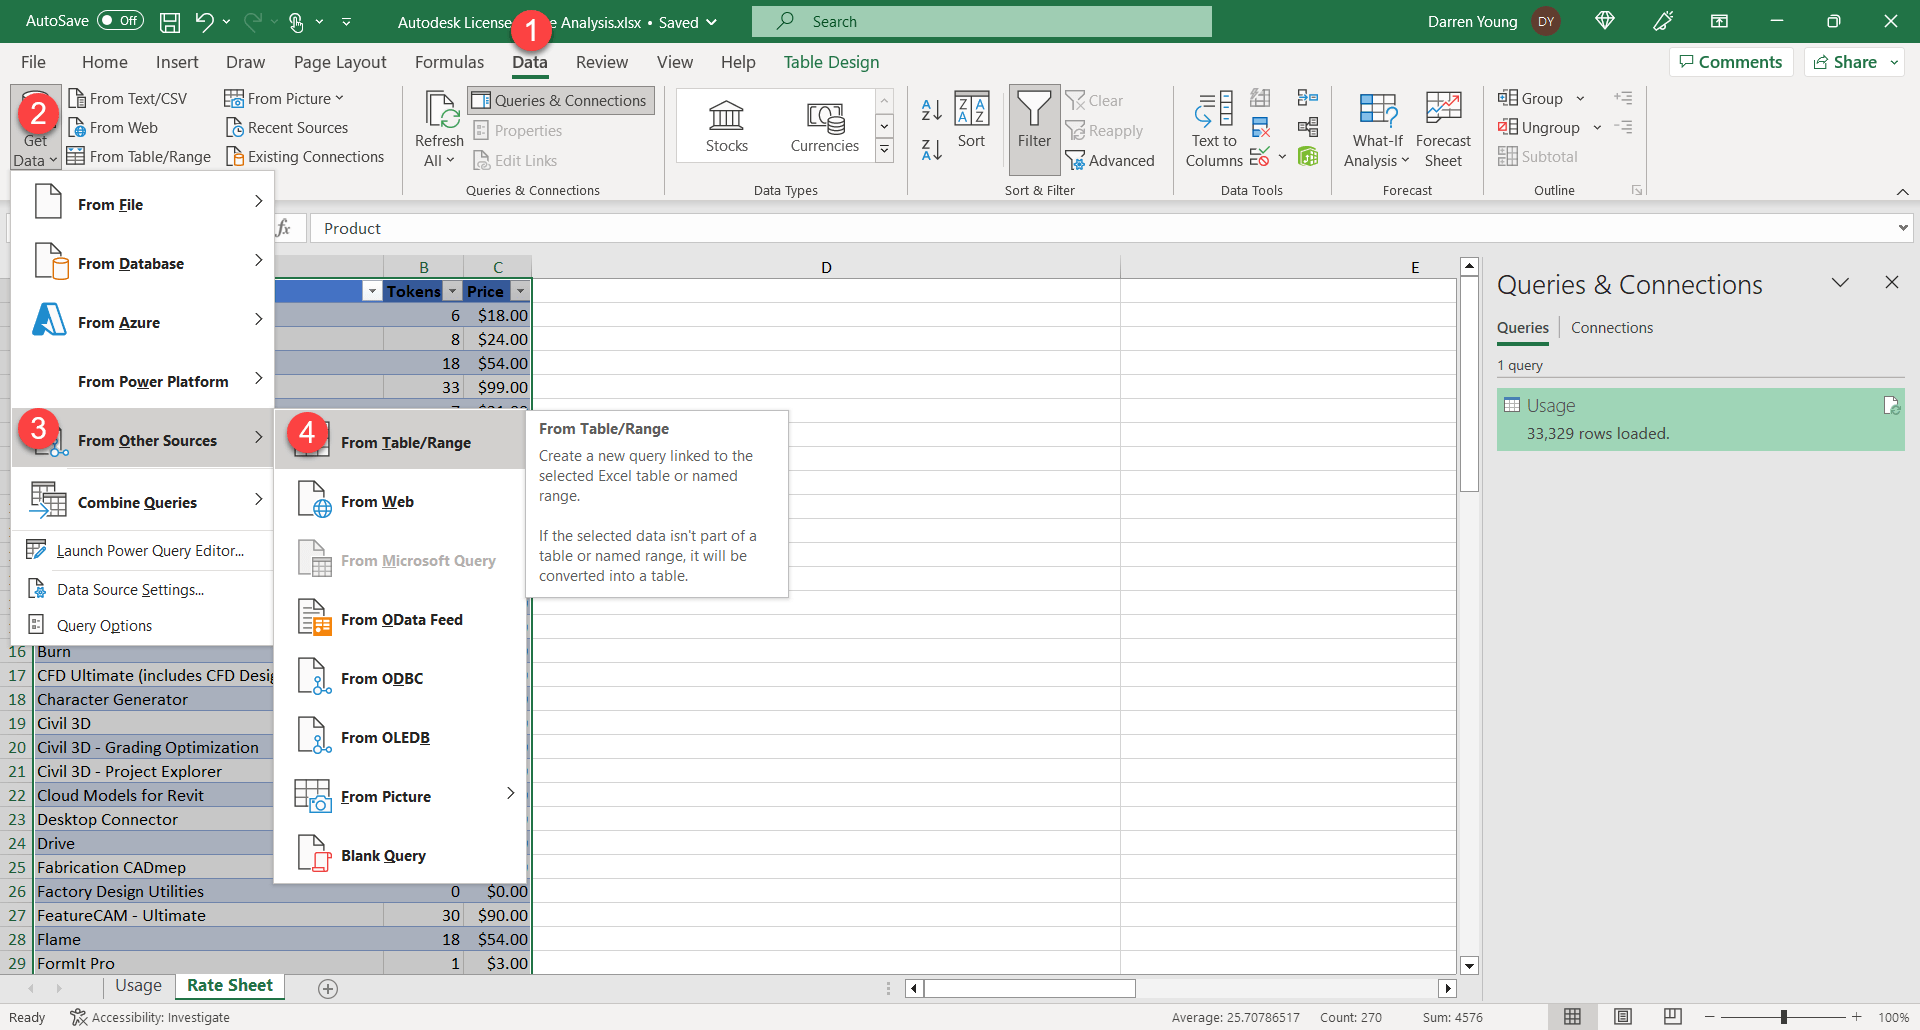
Next, let’s make a new query of this table. Select Data (1), Get Data (2), From Other Sources (3) then From Table/Range.
Step 17
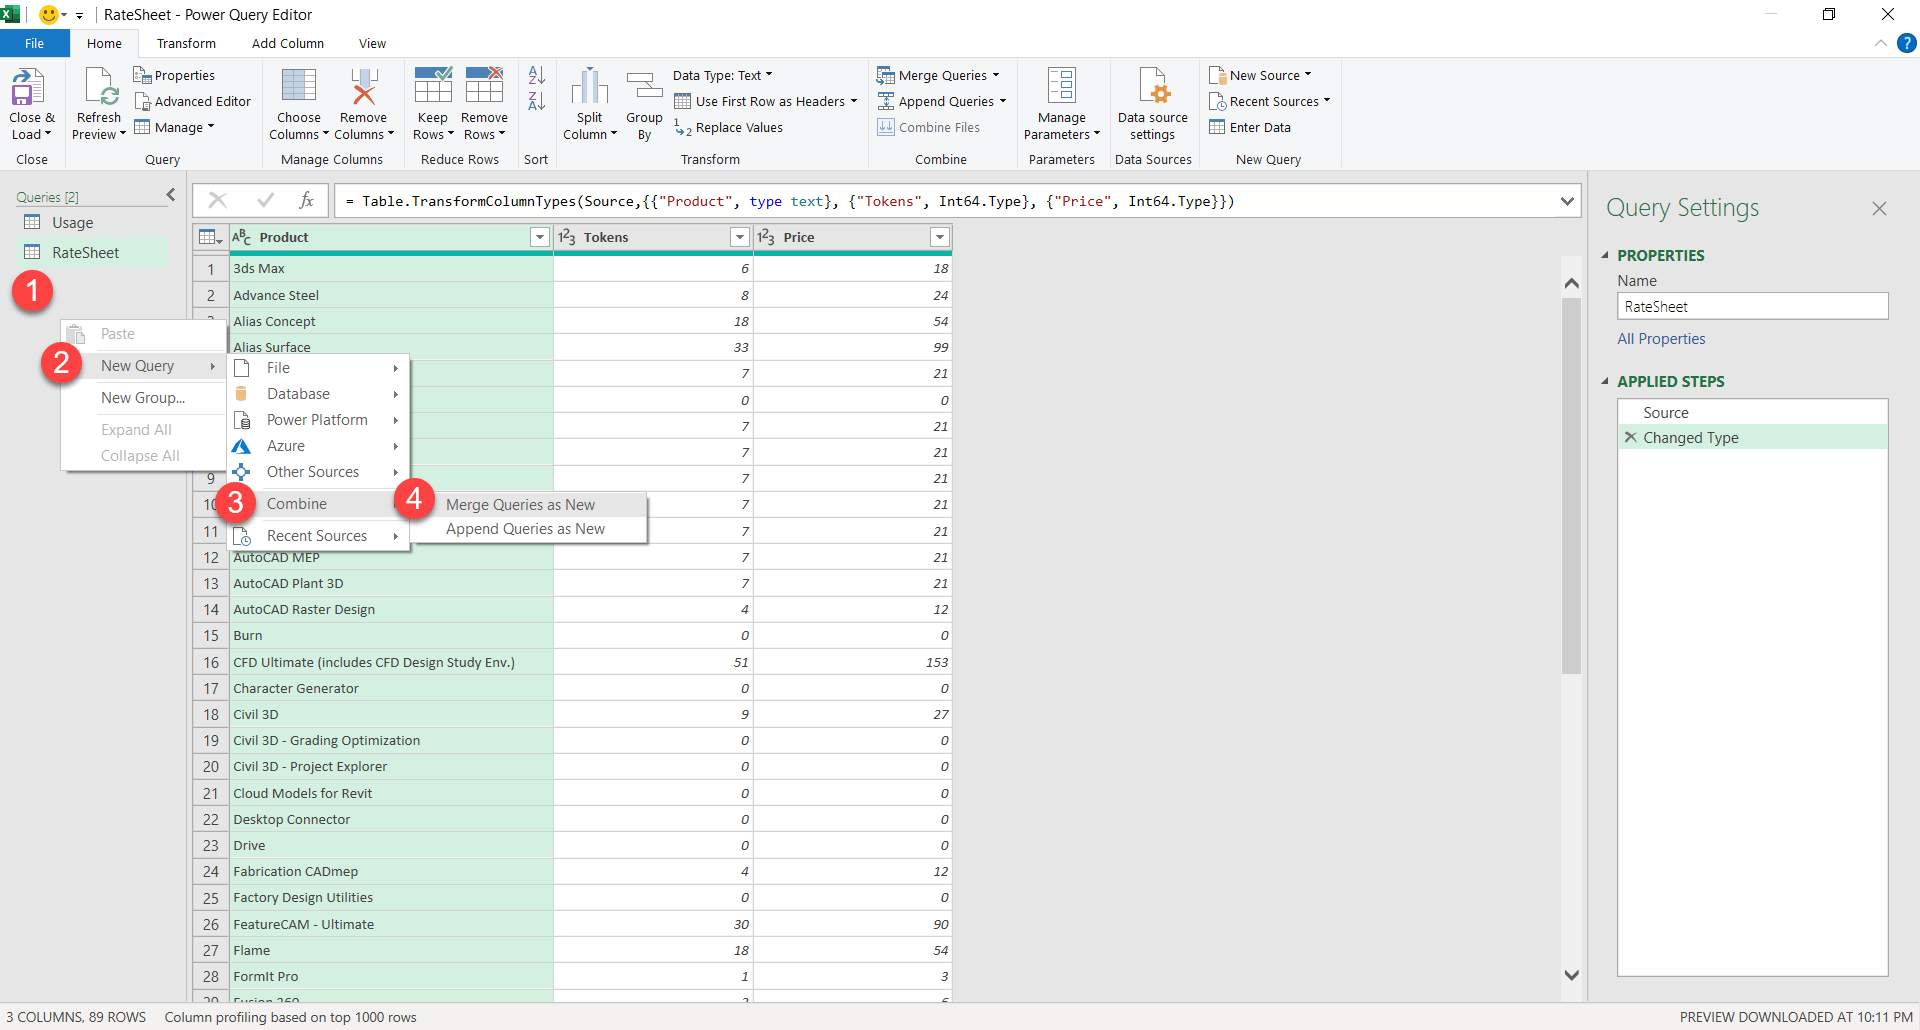
You’ll see Power Query brings in this table into the editor. Notice on the left in the Query palette the name RateSheet. This was a result of renaming the Table earlier otherwise you would have had a generic name that wasn’t as intuitive. You can rename Tables later but Power Query doesn’t see those renames and it’ll break your query.
We really don’t need to do anything with this query on the RateSheet. It’s there really for the next step where we merge those two queries together. Right-Click (1) on an open area of the Query palette. Select New Query (2), Combine (3) then Merge Queries as New (4).
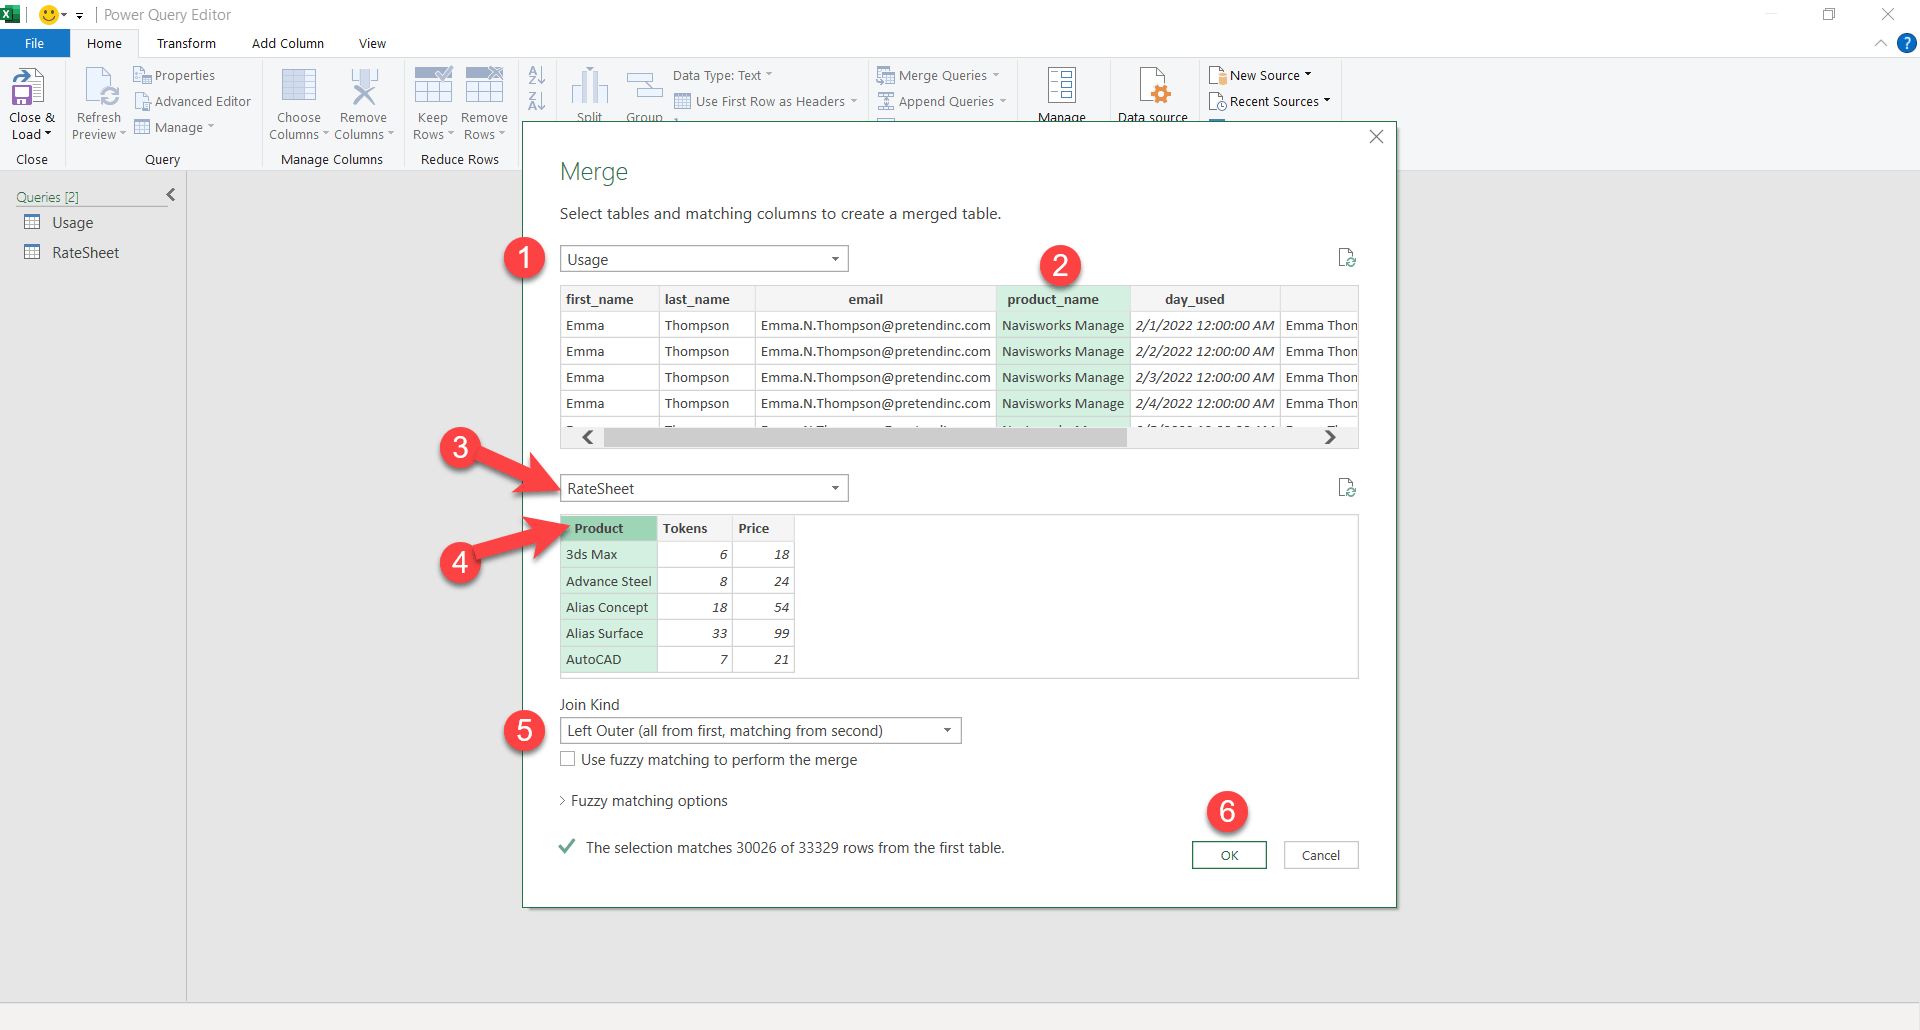
Step 18
From the merge dialog, select Usage (1) in the first dropdown list. Next, select the product_name (2) column. This is the data we’re going to use to lookup in the RateSheet. Next, select RateSheet (3) in the dropdown list and then the Product (4) column. Finally, we’ll tell it how to merge the tables by selecting Left Outer (all from first, matching from second) in the Join Kind dropdown list. Once everything is configured, ClickOK (6).
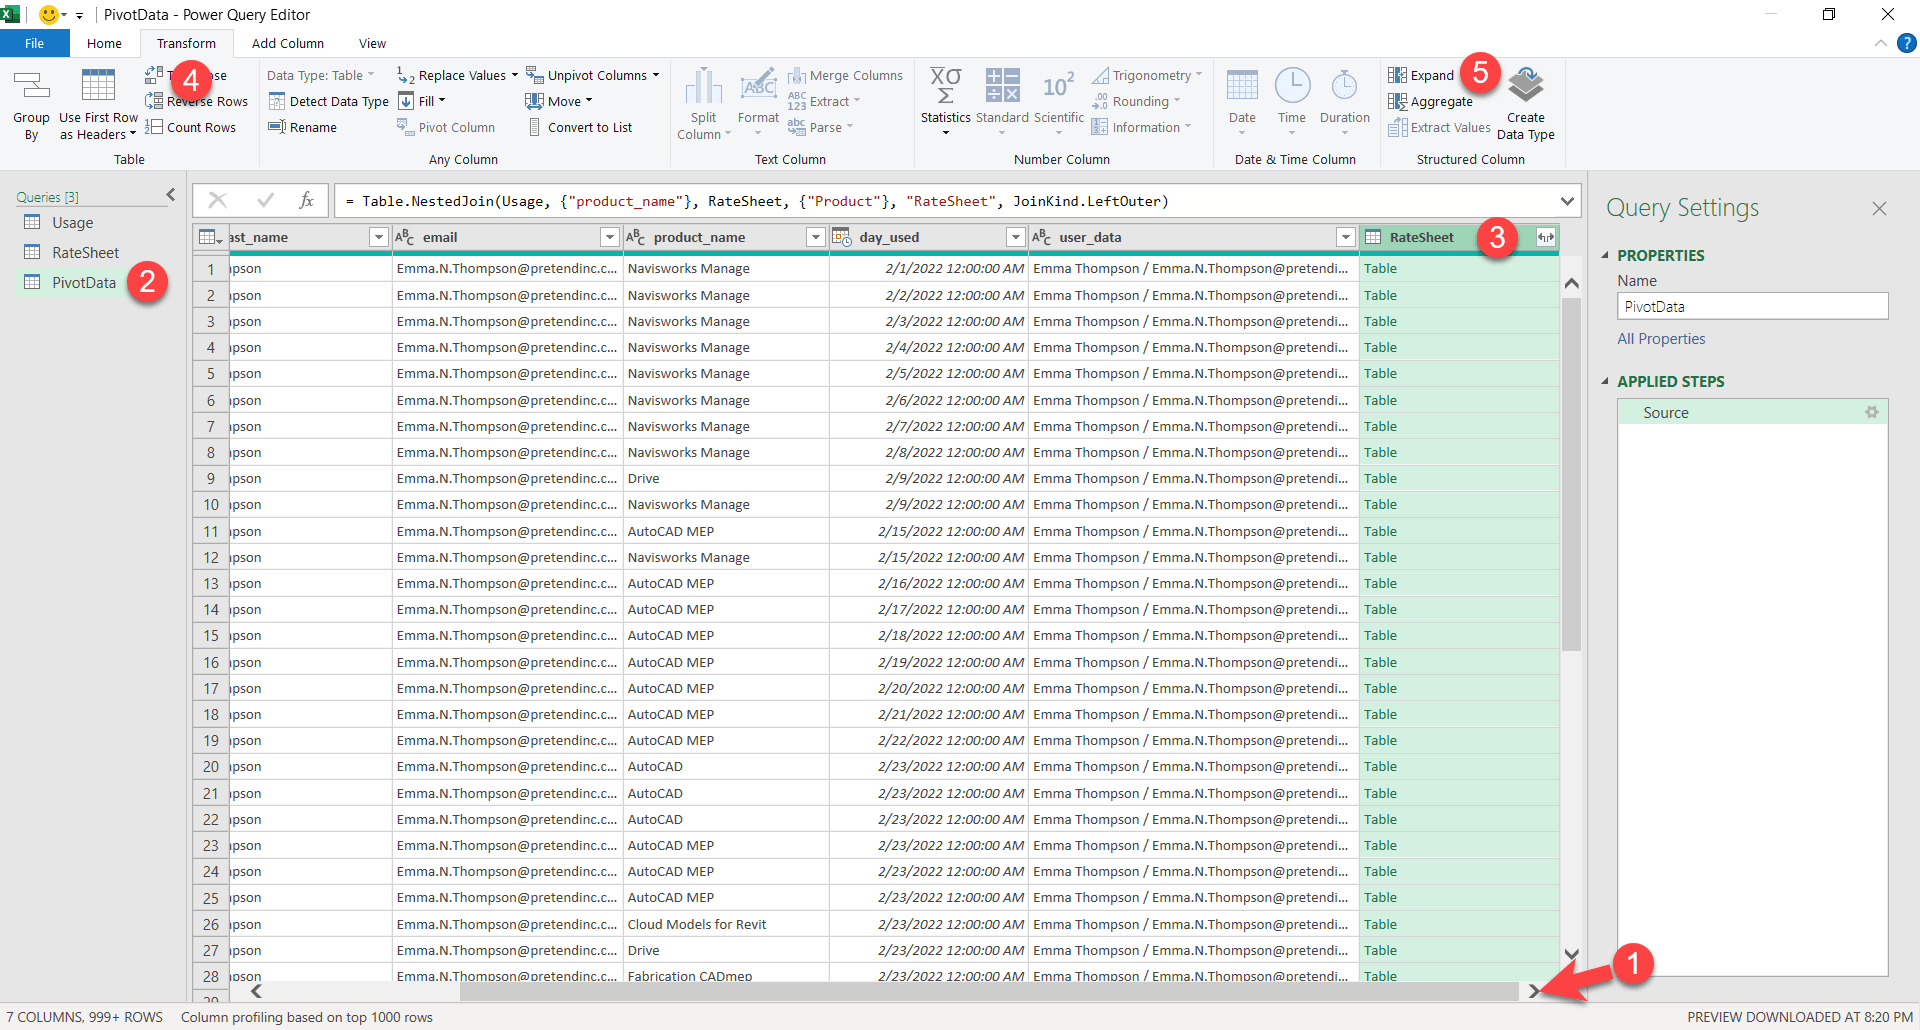
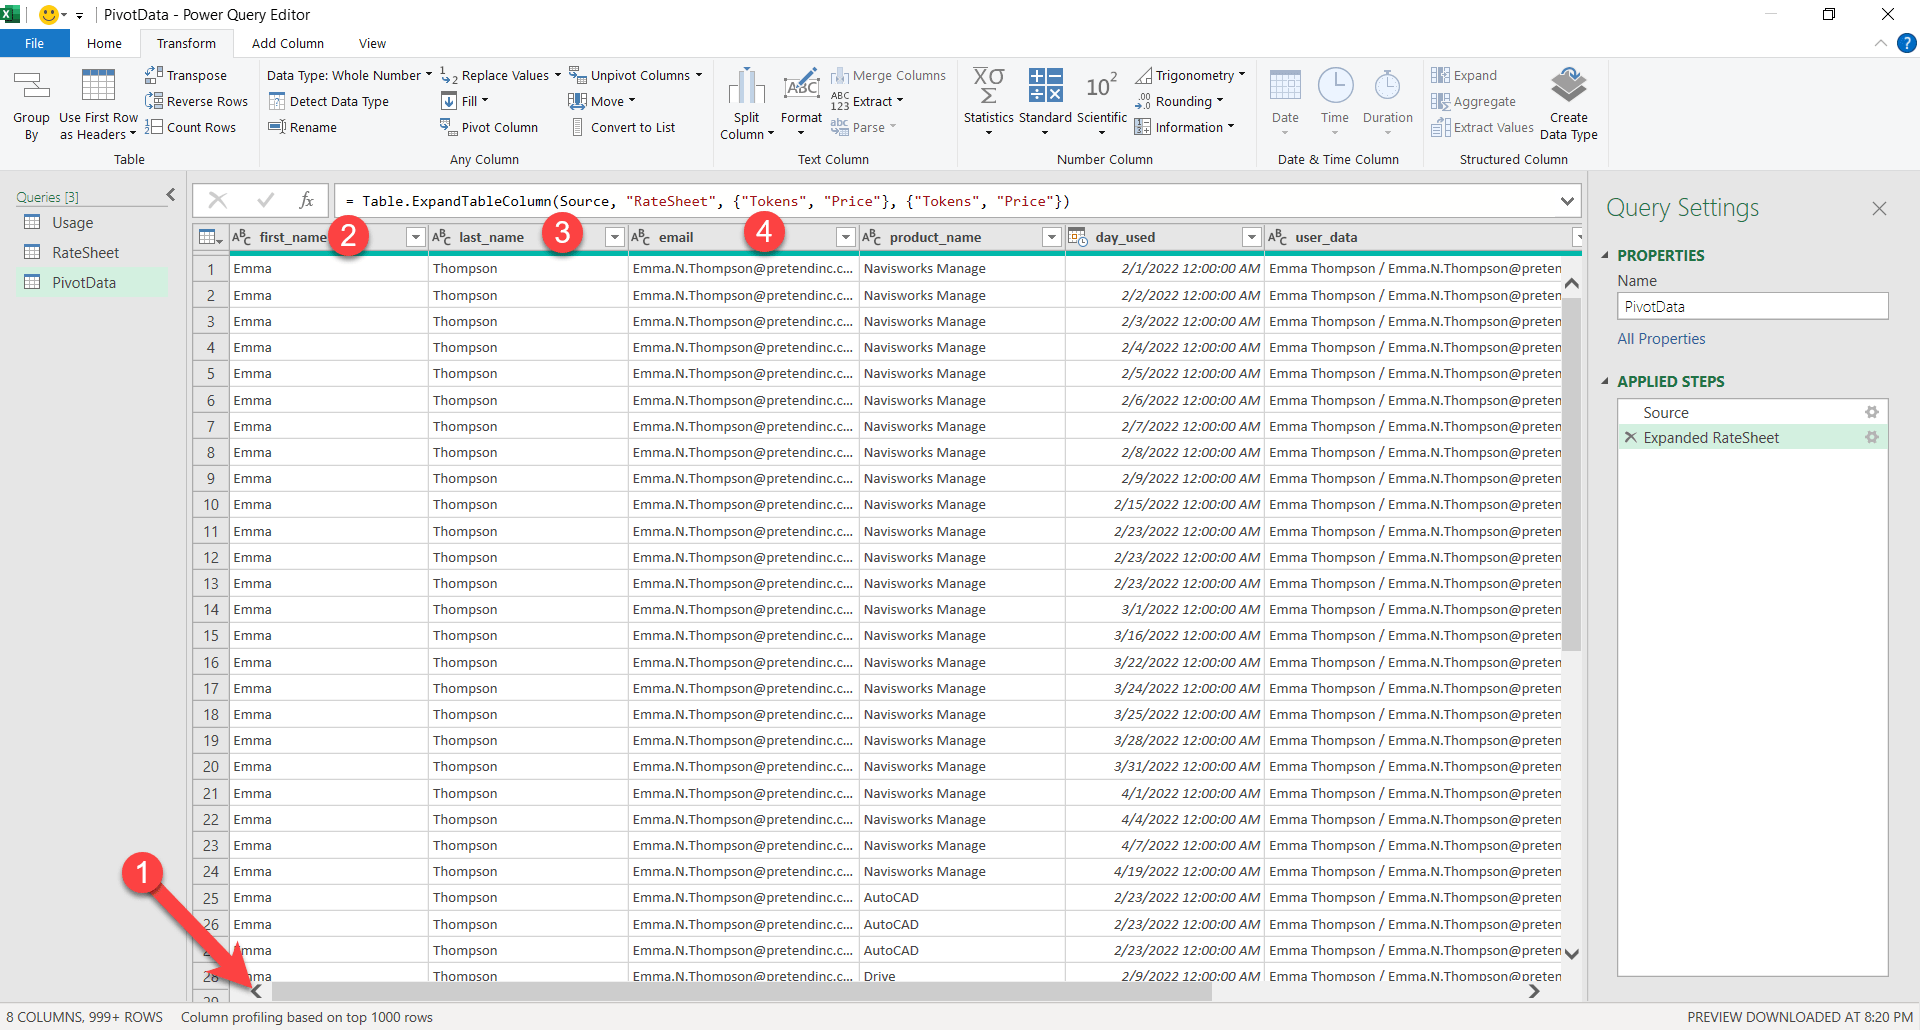
Step 19
If you scroll to the right (1) you’ll see the new column we added from the merge. On the left, Right-Click on the Merge# query and rename it to PivotData (2) so it’s more meaningful. Next, select the newly added column RateSheet (3). You’ll see that the data in the cells says “Table”. This merged in the entire row into a single table in that column. We want access to that data so it’s expend it by selecting Transform (4) and then Expand (5).
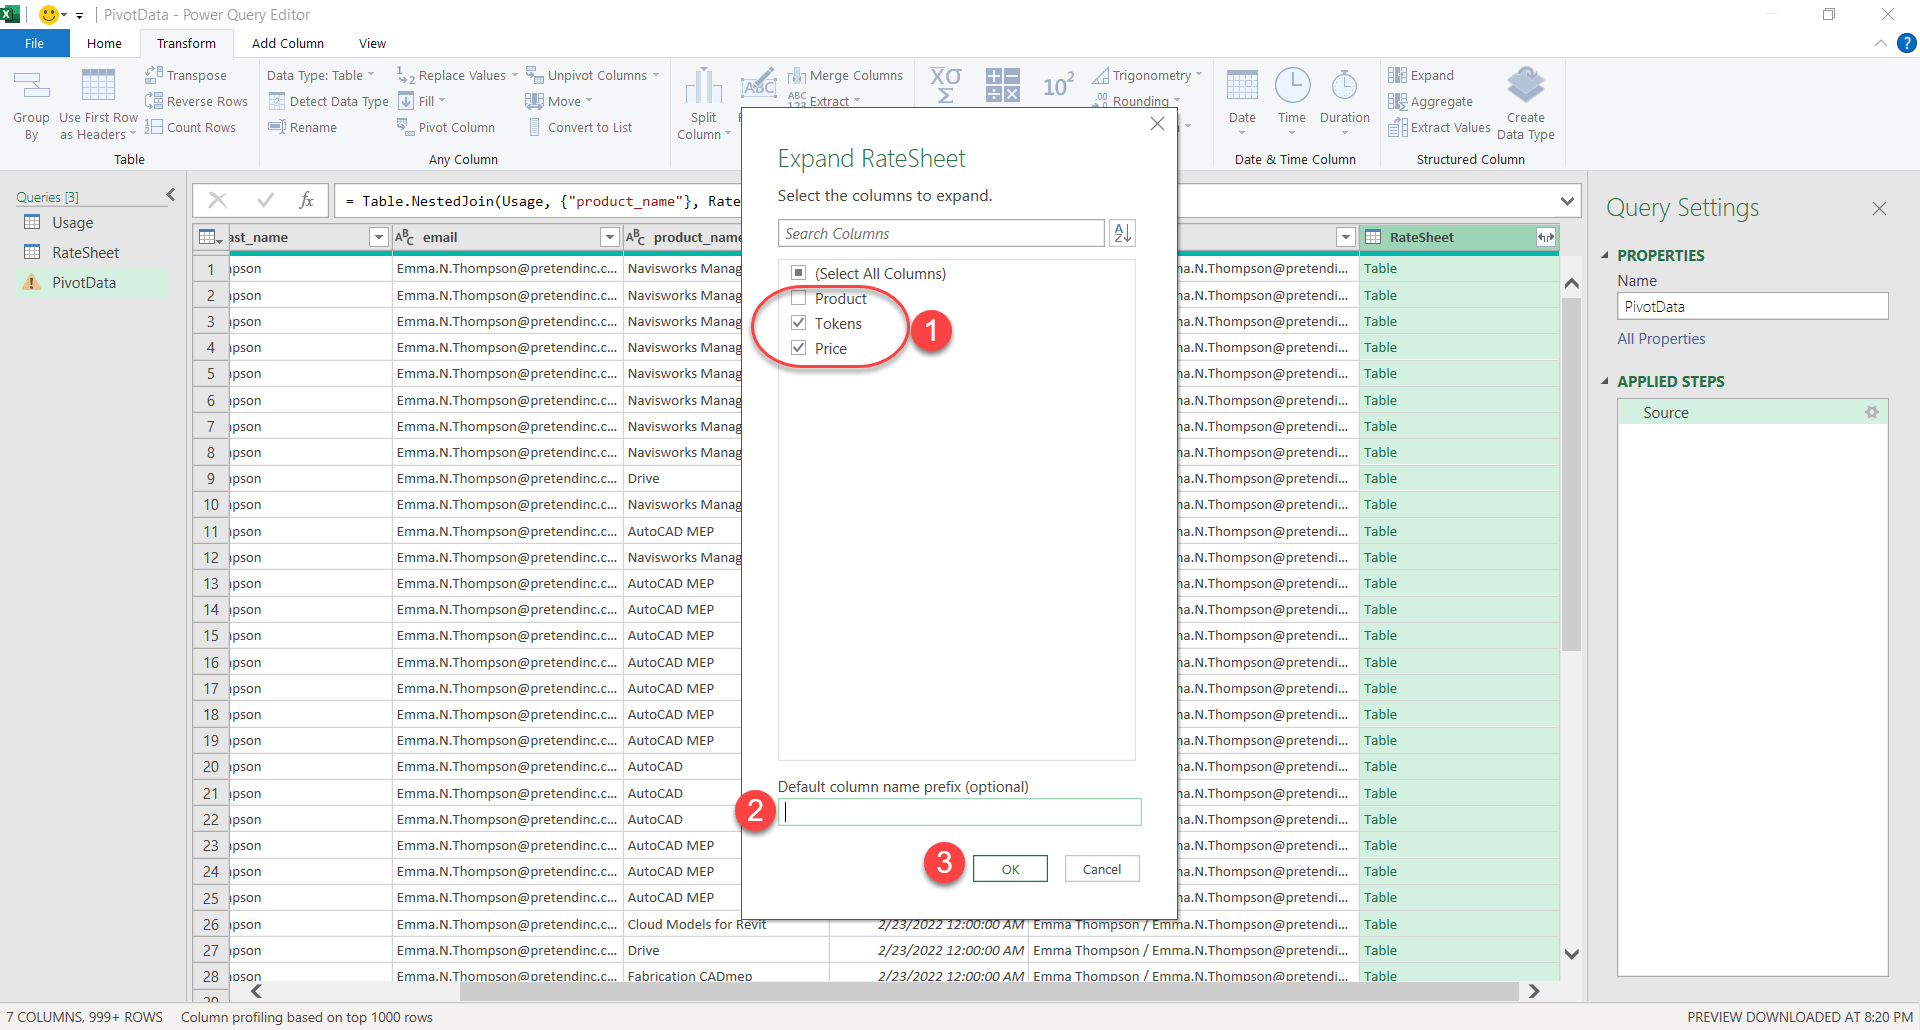
Step 20
You’ll get a dialog asking which columns you want to expand out of that table. We’ll unselectProduct (1) because we already have that in the usage data. We’ll leave Tokens (1) and Price (1). Clear the RateSheet text from the Defsult column name prefix (2) edit box than click OK.
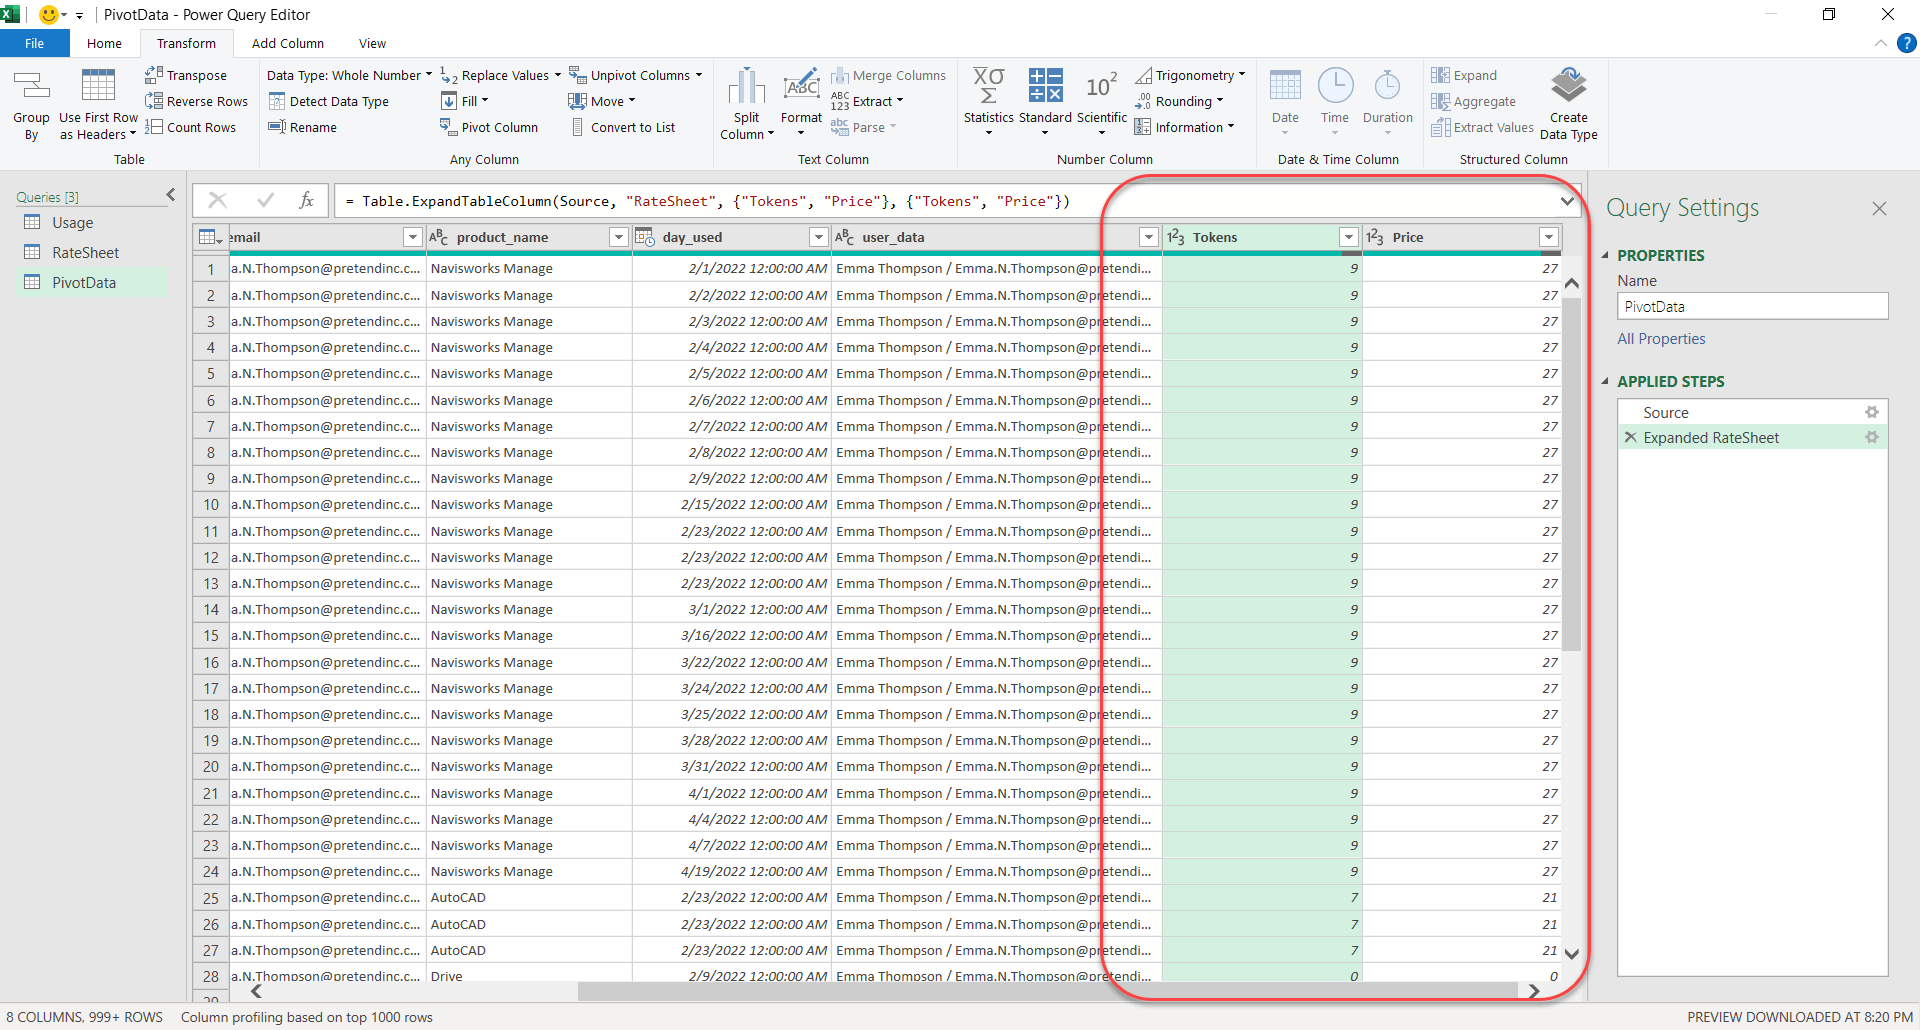
Step 21
You can now see the Tokens and Price columns added to this query. This really just looked up the value in the product_name column in the Usage query, found the corresponding value on the Product column of the RateSheet query and pulled in it’s Token and Price data.
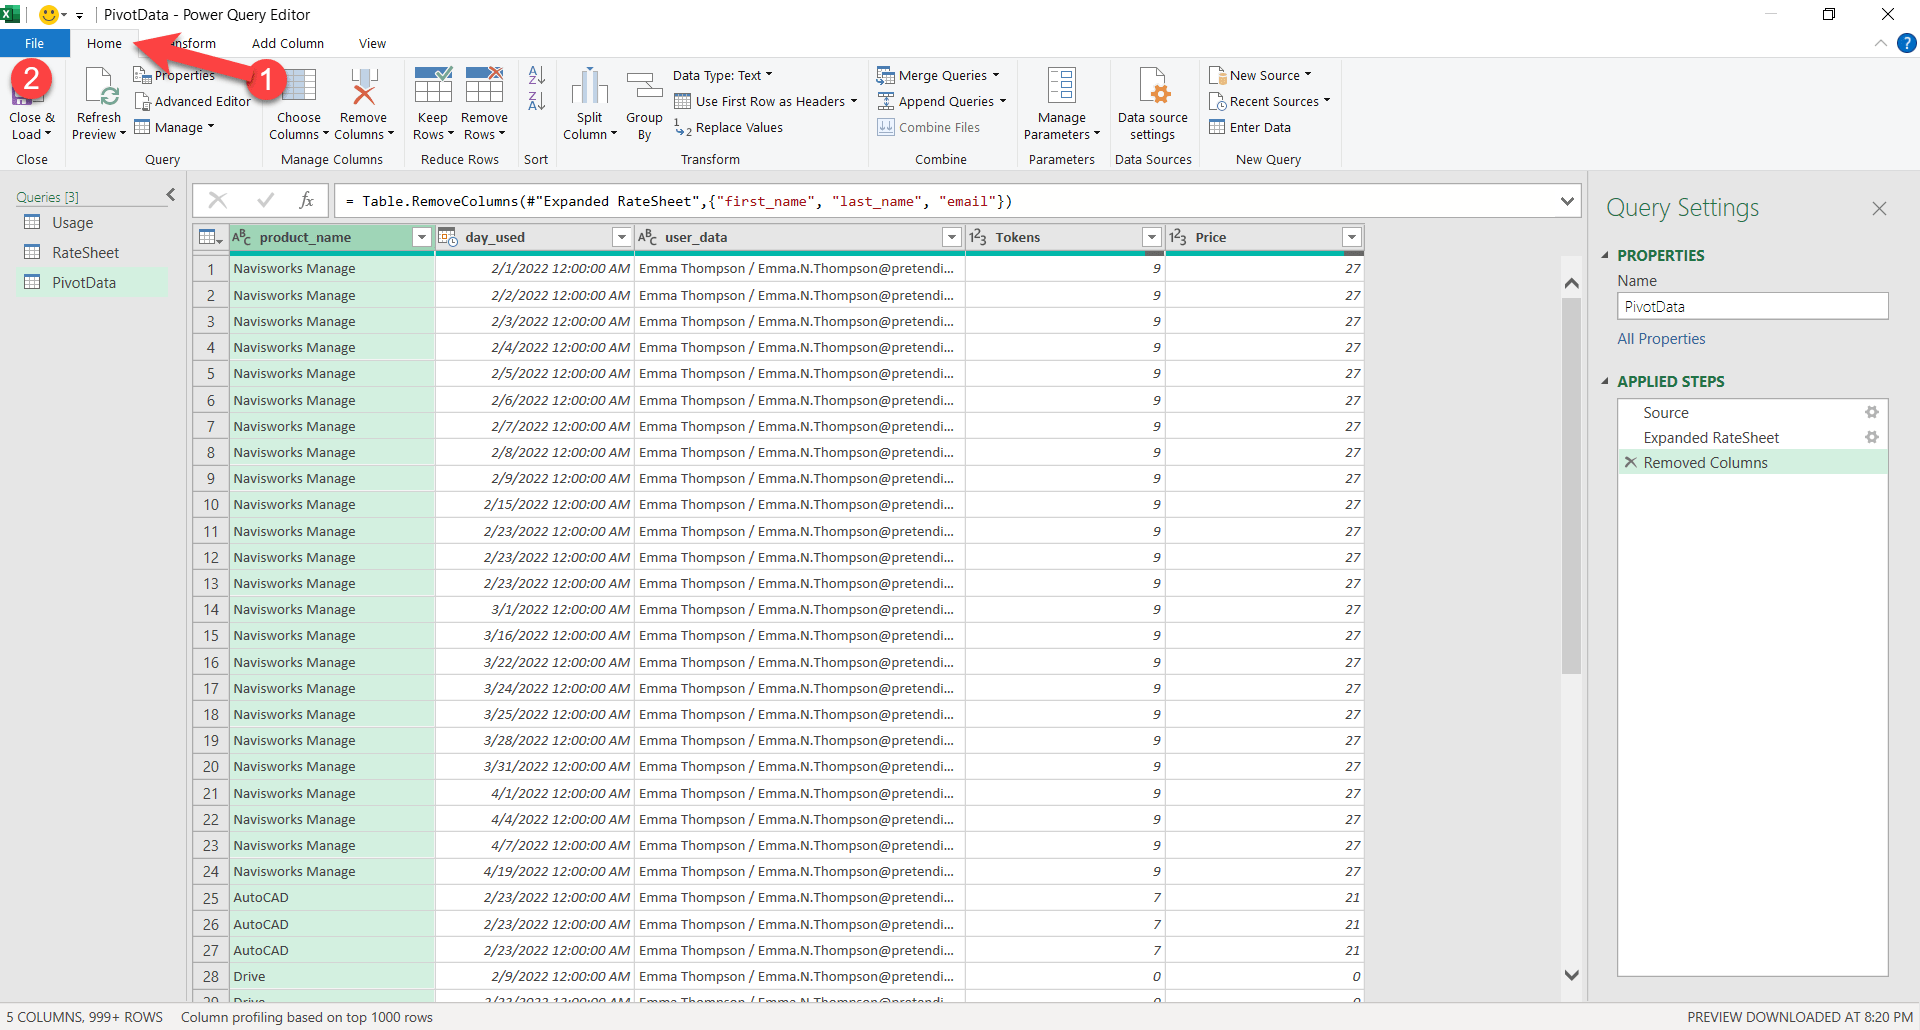
Step 22
Next, we no longer need some of the columns. Scroll to the left (1) and right click on the first_name(2) column and select Remove. Repeat for the last_name and email columns to remove them. This will clean up the data out Pivot table will use.
Step 23
We’re finally done cleaning, filtering and augmenting our data. Let’s click the Home tab (1) and then Close & Load.
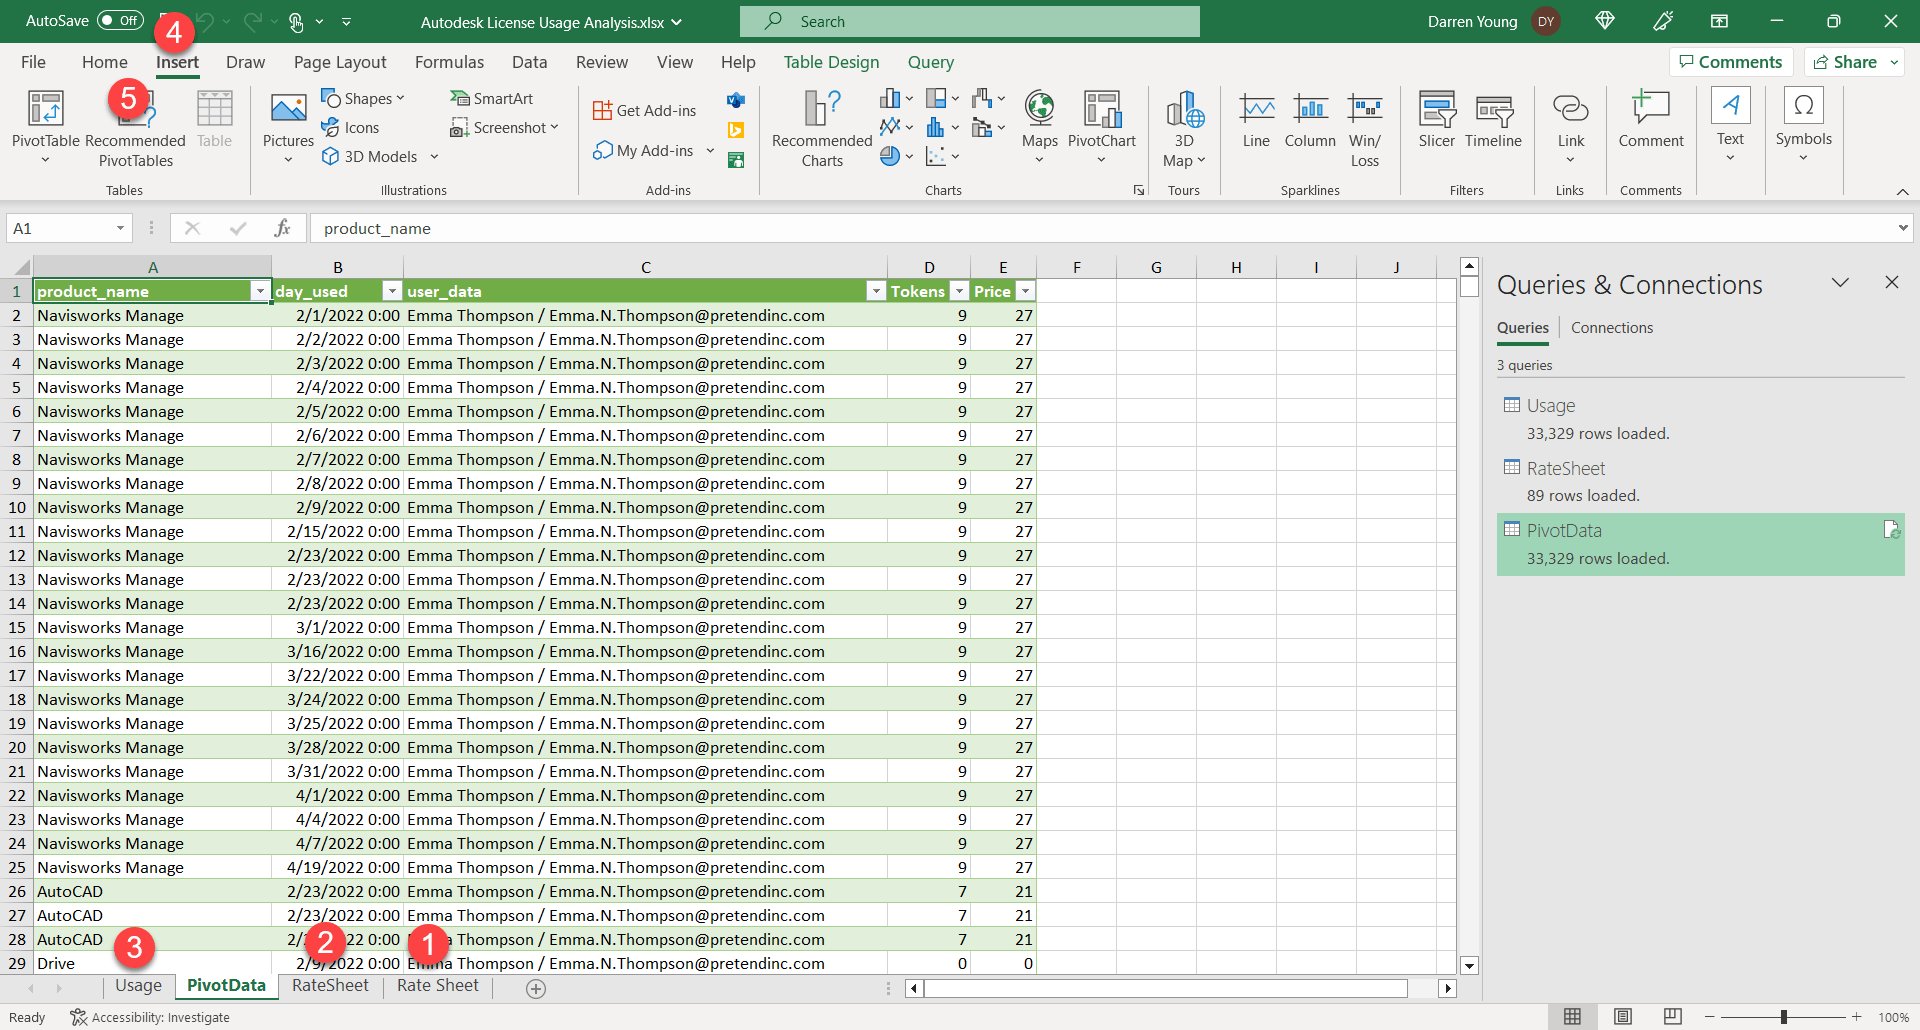
Step 24
We’re now back in Excel and our last two queries were added as separate tabs. You’ll see that we have a tab named RateSheet (no space) and Rate Sheet (with space). The one with the space was our original data we turned into a table. The one without the space is our query of that original. In hind sight, we perhaps could have named it RateQuery to make it more intuitive. You could try to rename it now and see if it breaks your queries. If it does, you could try fixing or deleting and doing them over. Or you could leave it which is what I’ll do.
We’ll hide the unneeded tabs by using Right-Click and selecting Hide for the table Rate Sheet (1), RateSheet (2) and Usage (3). Next, we’ll make out Pivot Table be selecting Insert (4) then Recommended Pivot Tables (5).
Step 25
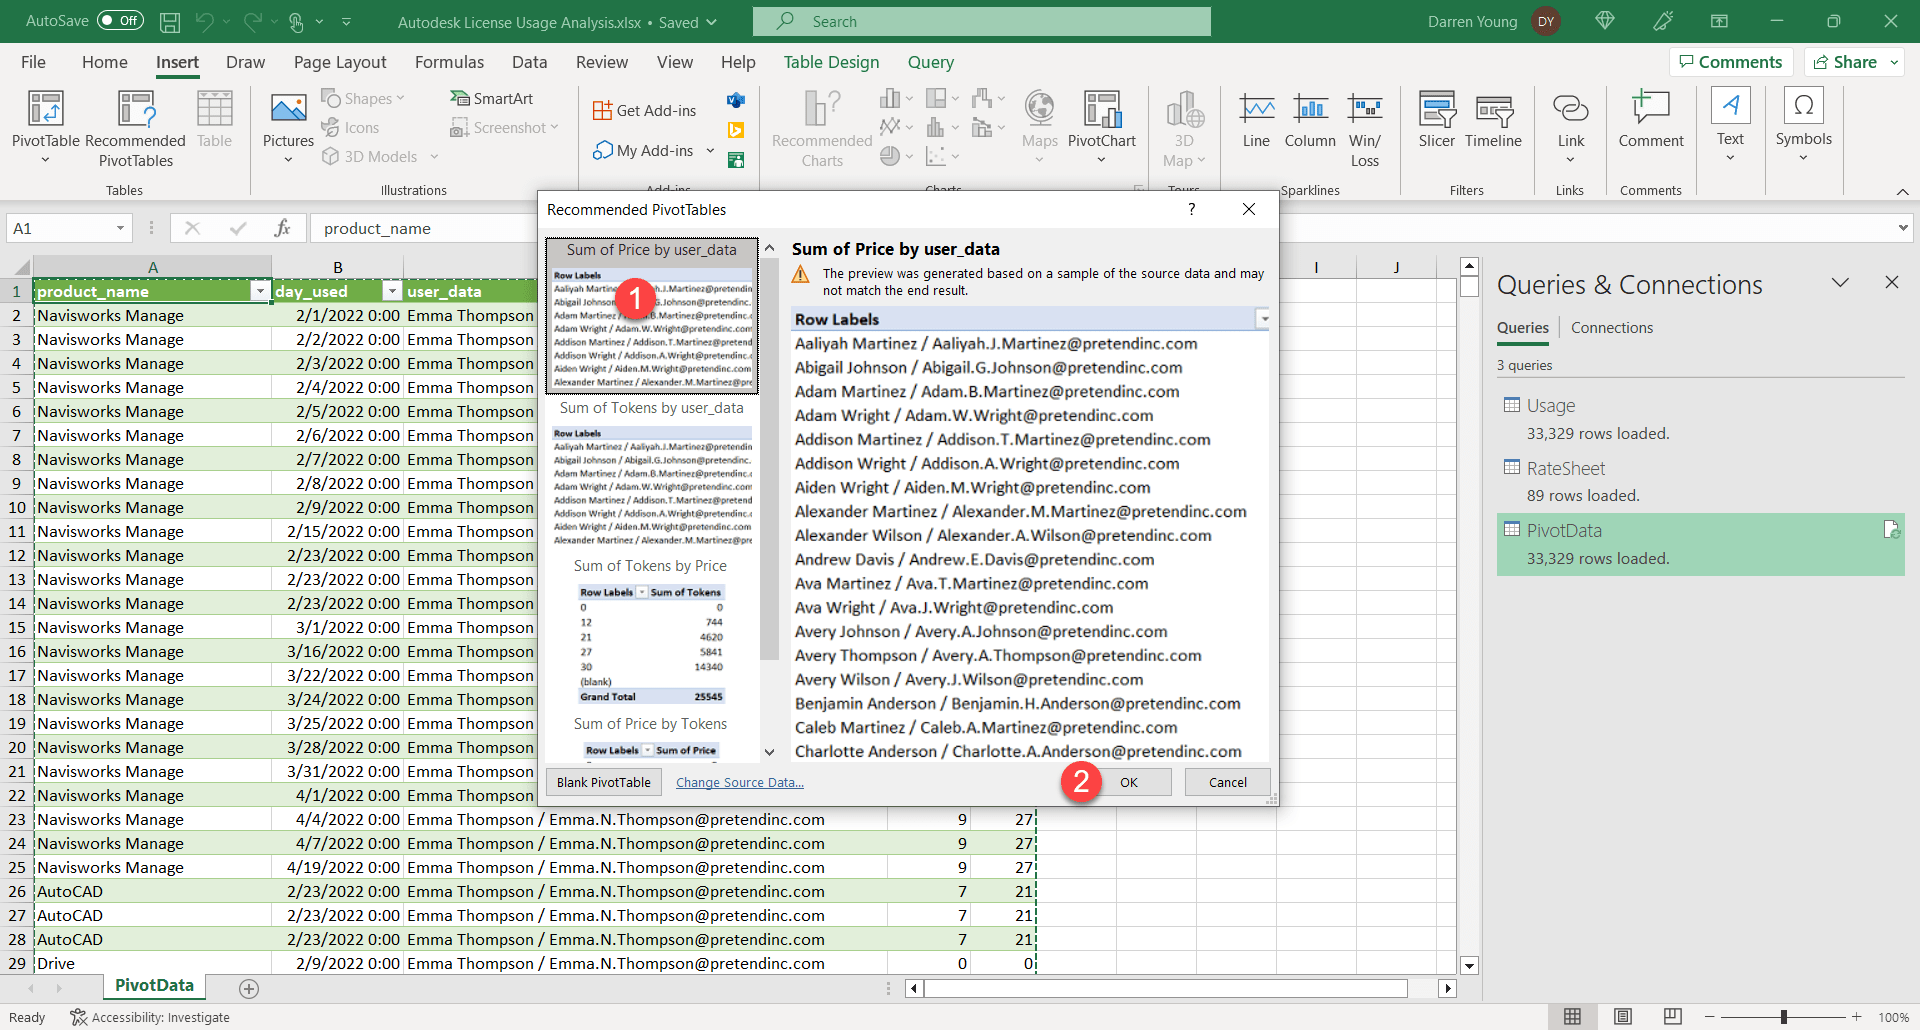
In the Recommended Pivot Tables dialog, you can scroll through and pick one that looks close. I rarely do that. Instead I just pick one and worry about modifying it later. Here I pick the first one (1) and then click OK.
Step 26
Here, you can see out beginning Pivot Table. It’s not too far off but we can improve it. For now, we’ll just rename that Sheet1 tab to something more meaningful like Analysis Pivot by right-clicking on the tab and selecting Rename (1).
Step 27
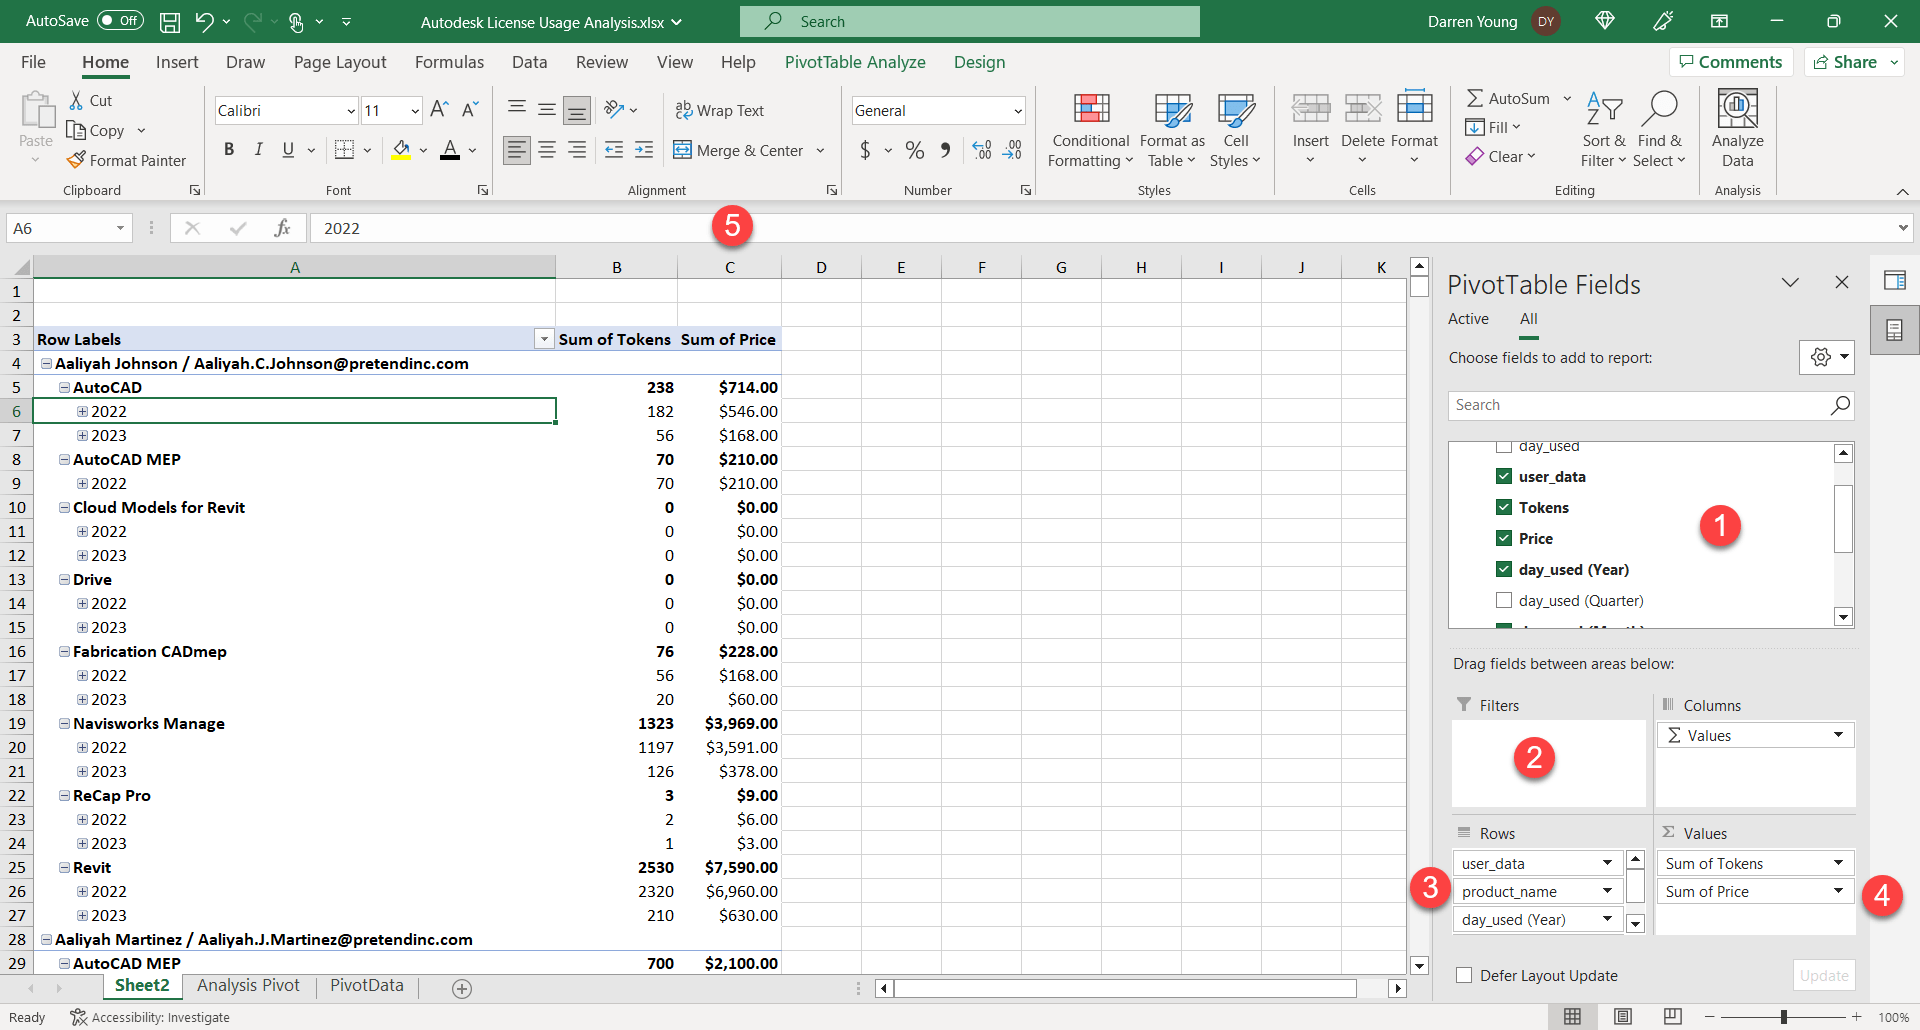
To update the Pivot, just drag fields from the PivotTable Fields section (1) to the Filters (2), Rows (3) and Values (4) sections. If you add to the Filters section, it shows up on the Pivot Table. I tend to leave it blank as I can more easily filter multiple values elsewhere (I’ll show later). I’ve also formatted the entire Price column to display as currency.
The fields I have in Rows are user_data, product_name, days_used (Year) and days_used (Month). Note that in our Pivot data we only had a date field. Excel automatically adds multiple fields to help you group dates. If this doesn’t happen, remove ALL the date fields from the Rows section and re-add the days_used, You should get multiple fields added. I typically remove the Quarter and Day.
For the Values column, I’ve added Tokens and Price. Once I get all the fields I want, I then do a little work on formatting. For starters, I make Column C/Price (5) formatted as Currency.
Step 28
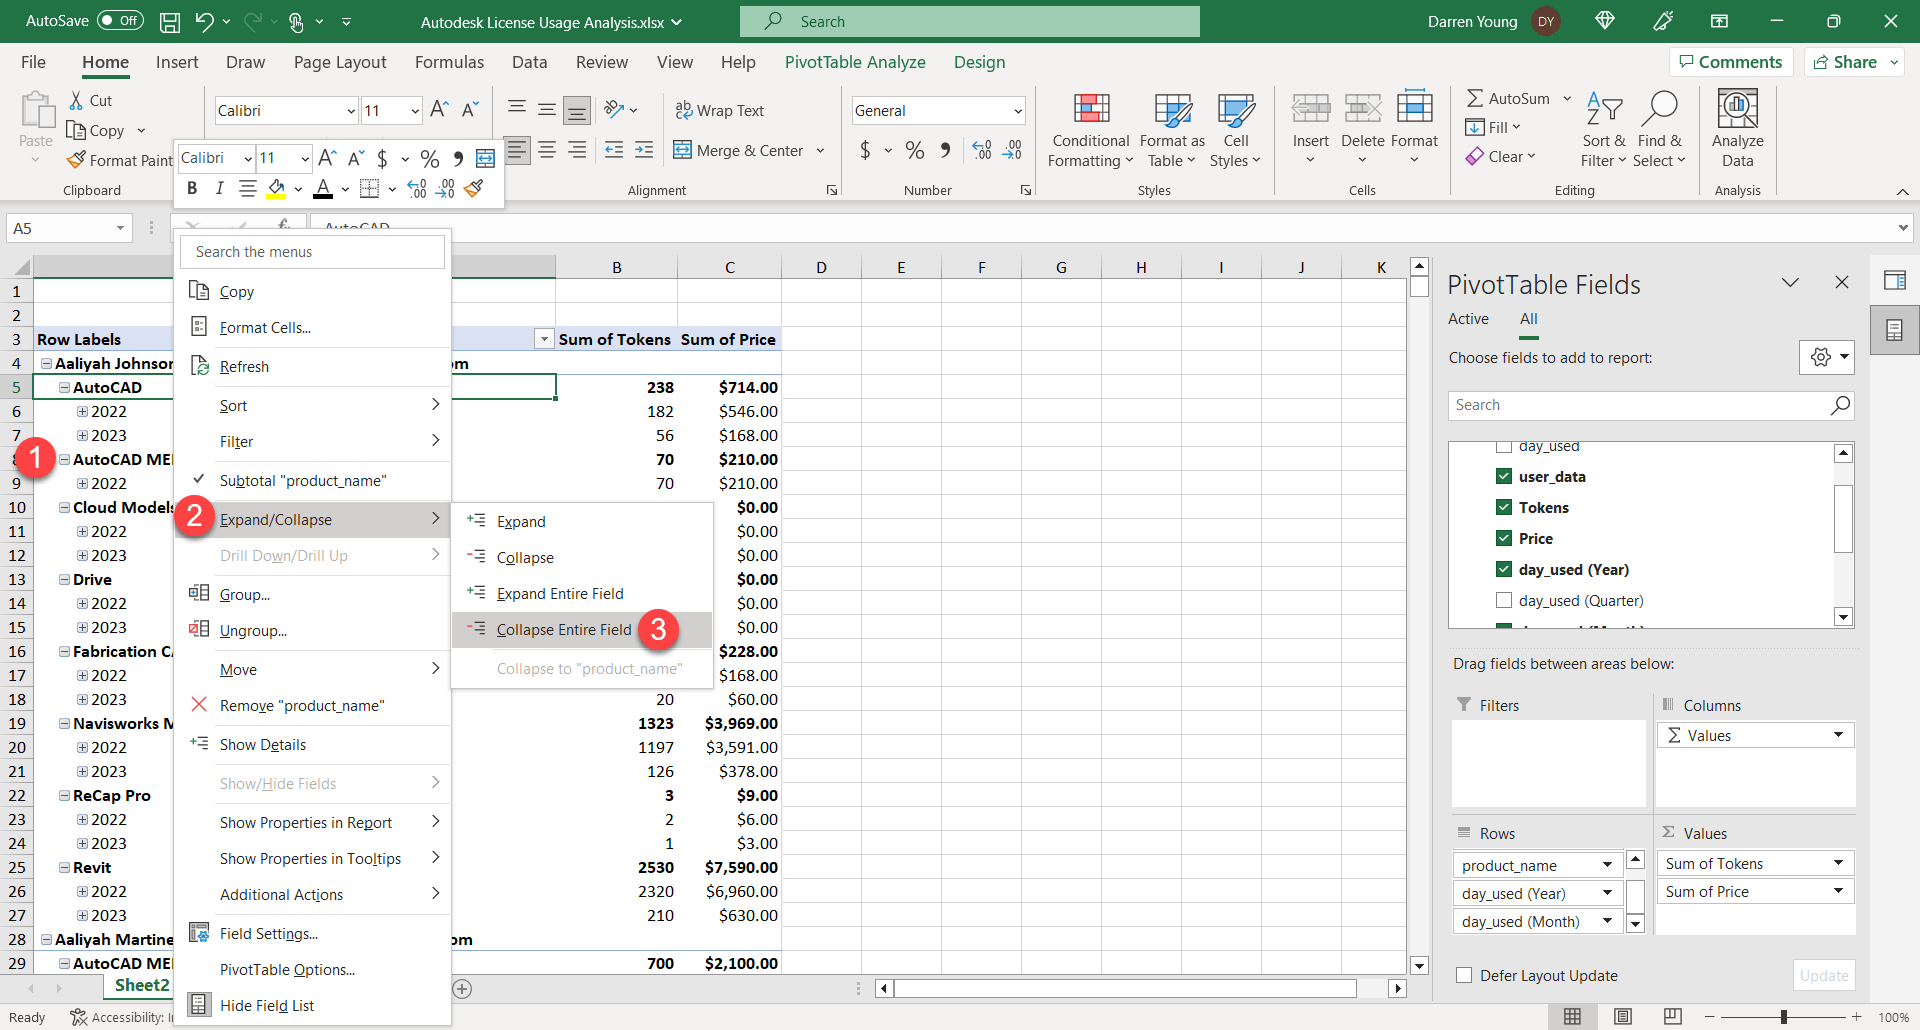
Next, lets Right-Click on the product name data (1) in the Pivot Table and select Expand/Collapse (2) then Collapse Entire Field. This collapses everything down to the Product level.
Step 29
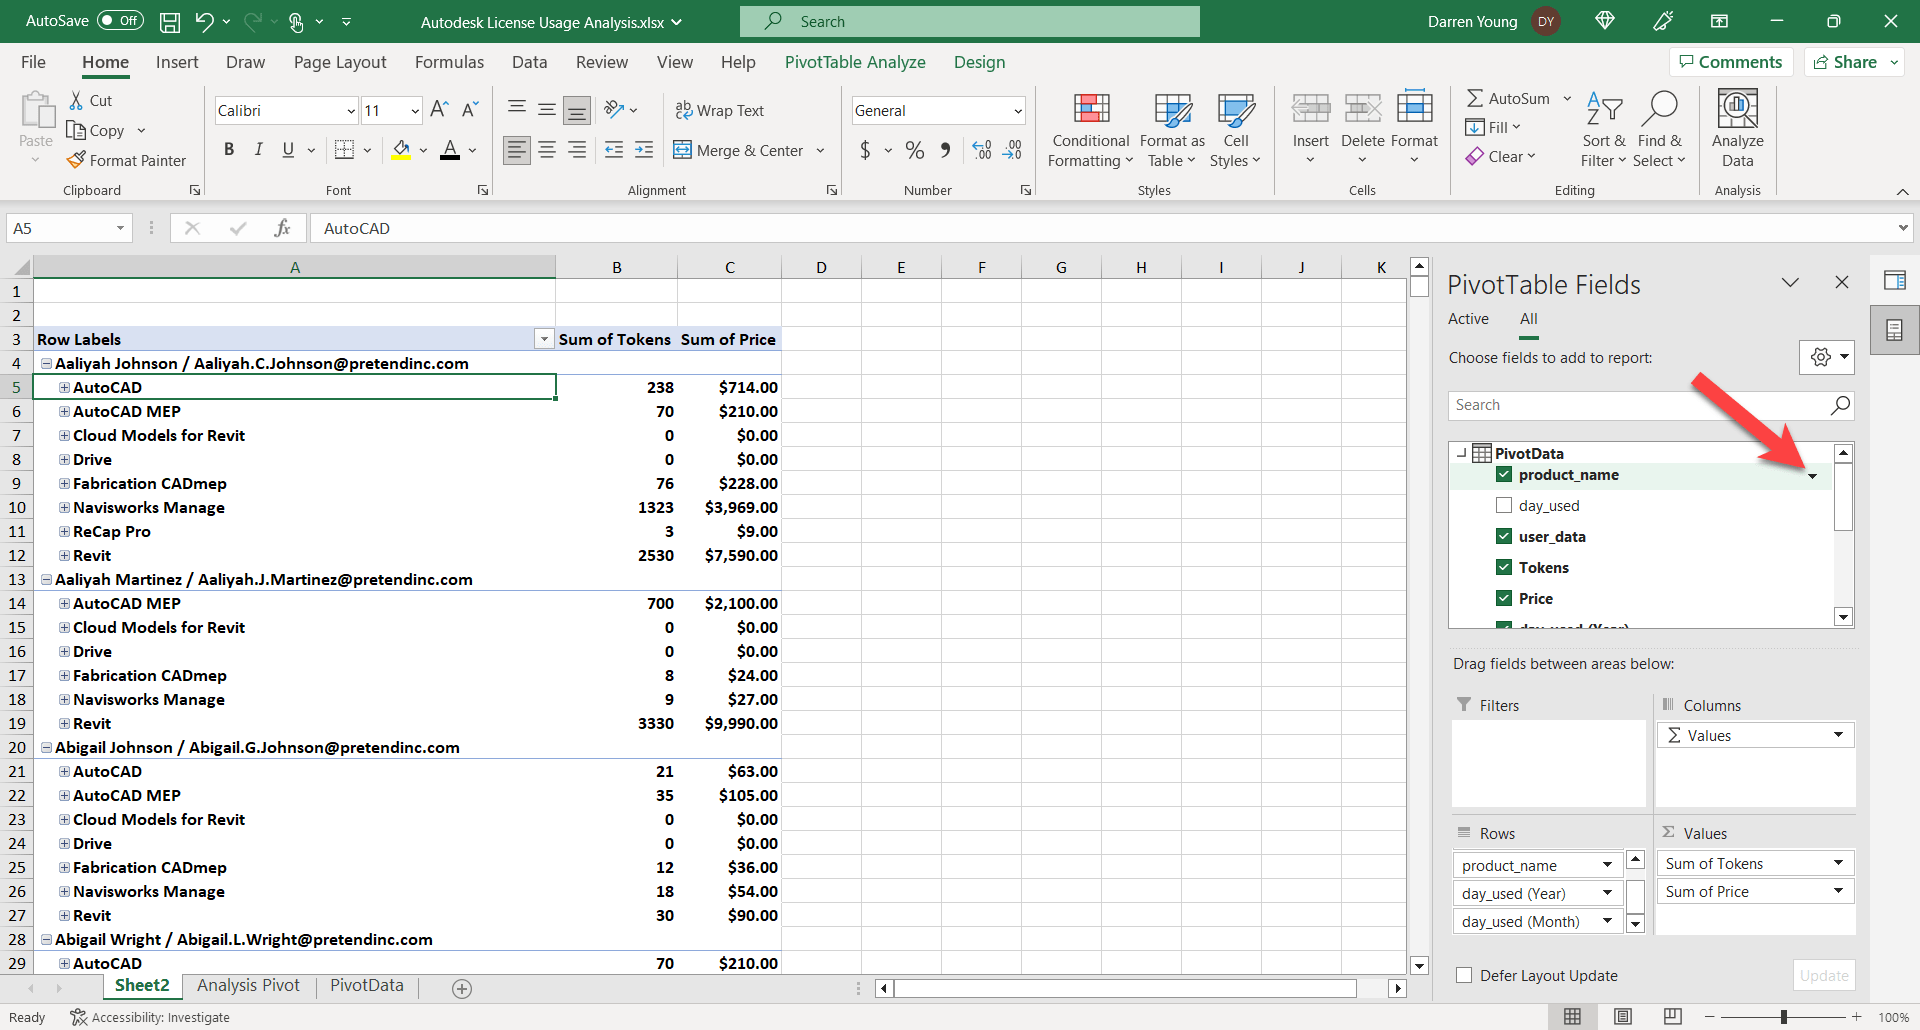
Remember when I said I prefer to filter a different way? Here, I can filter the products I want in my Pivot. Products that don’t use Tokens and aren’t in the Rate Sheet don’t appear (in case you were wondering). We’re not concerned with that. If they aren’t available with Flex licensing, there’s no need for analysis.
But if you look at the following image, you can when you hover over the product_name field there’s a little down facing triangle. Click on that to get to our filtering.
Step 30
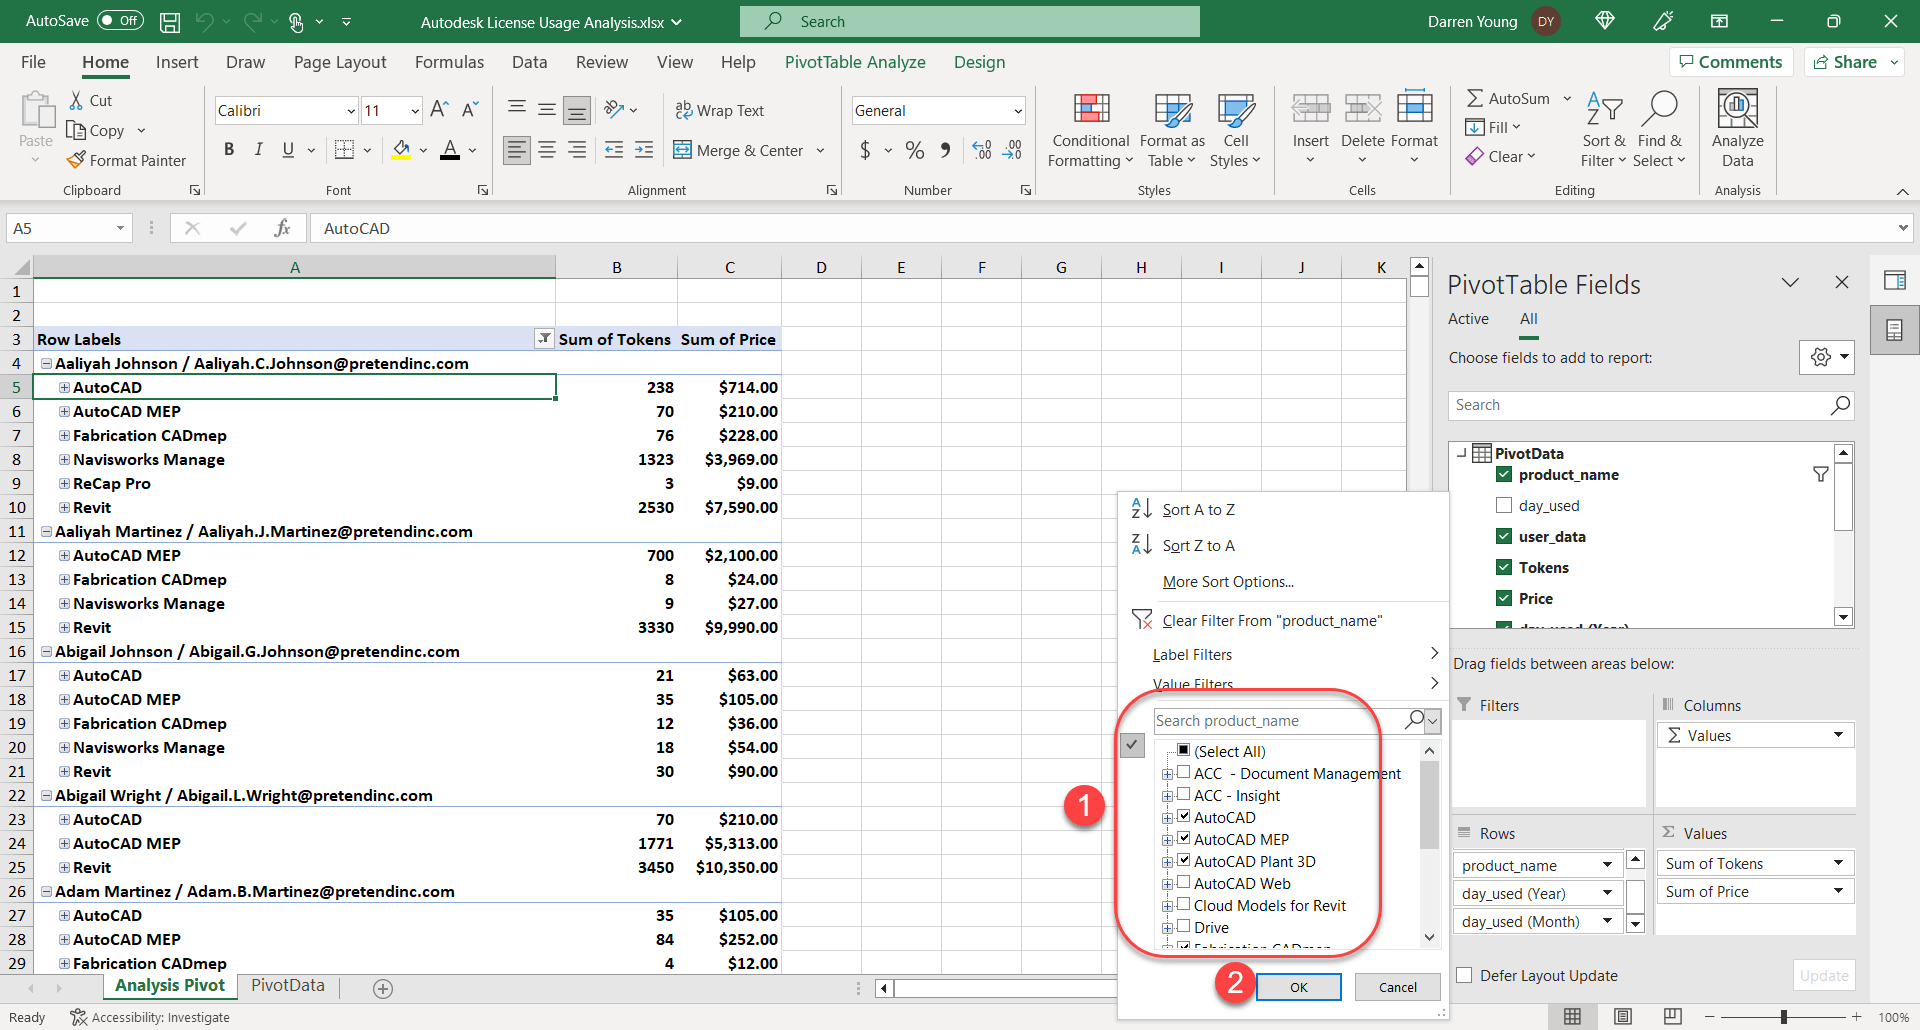
In the filter dialog, I’m going to shut off all products (1) that are not in the AEC Collection as well as any product that uses zero tokens (see your token rate sheet). The remaining product I have (yours will be different) are AutoCAD, AutoCAD MEP, AutoCAD Plant 3D, Fabrication CADmep, Navisworks Manage, Recap Pro and Revit. You could leave on the zero token products if you like, I just didn’t want to type them all here! Once done, click OK (2).
Step 31
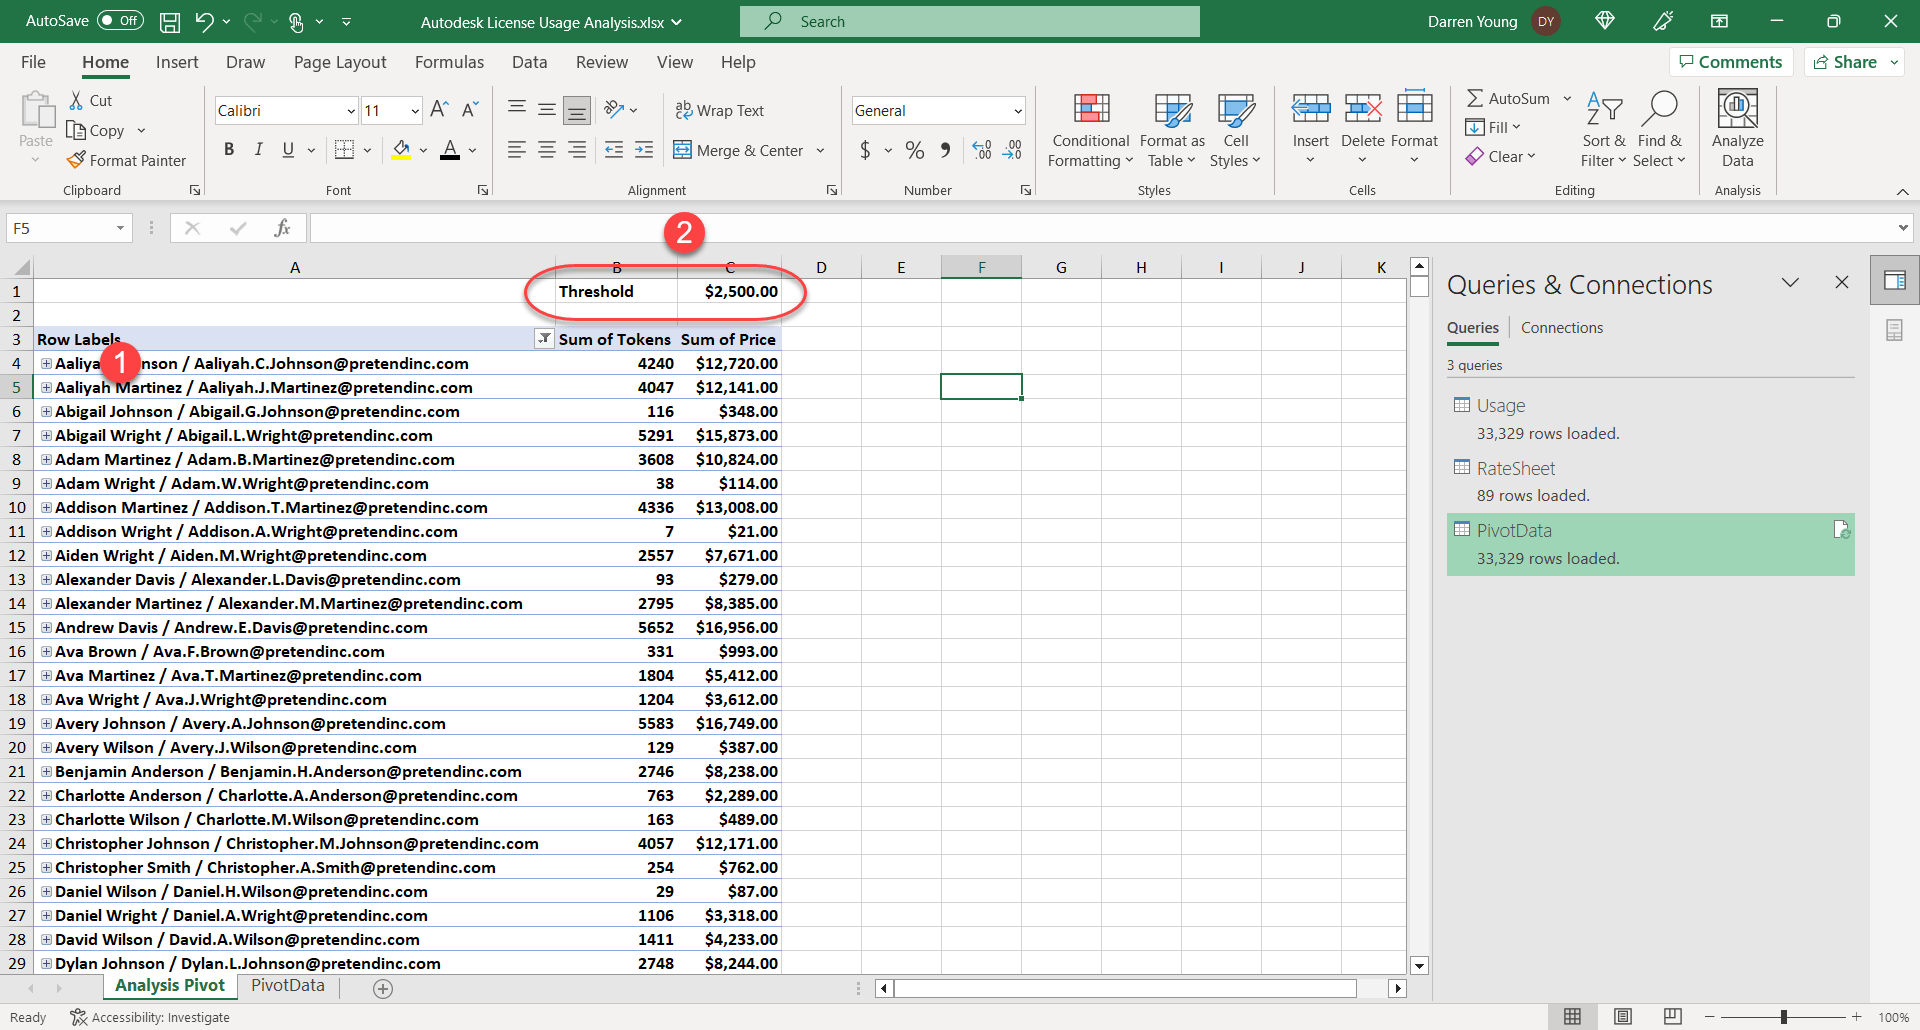
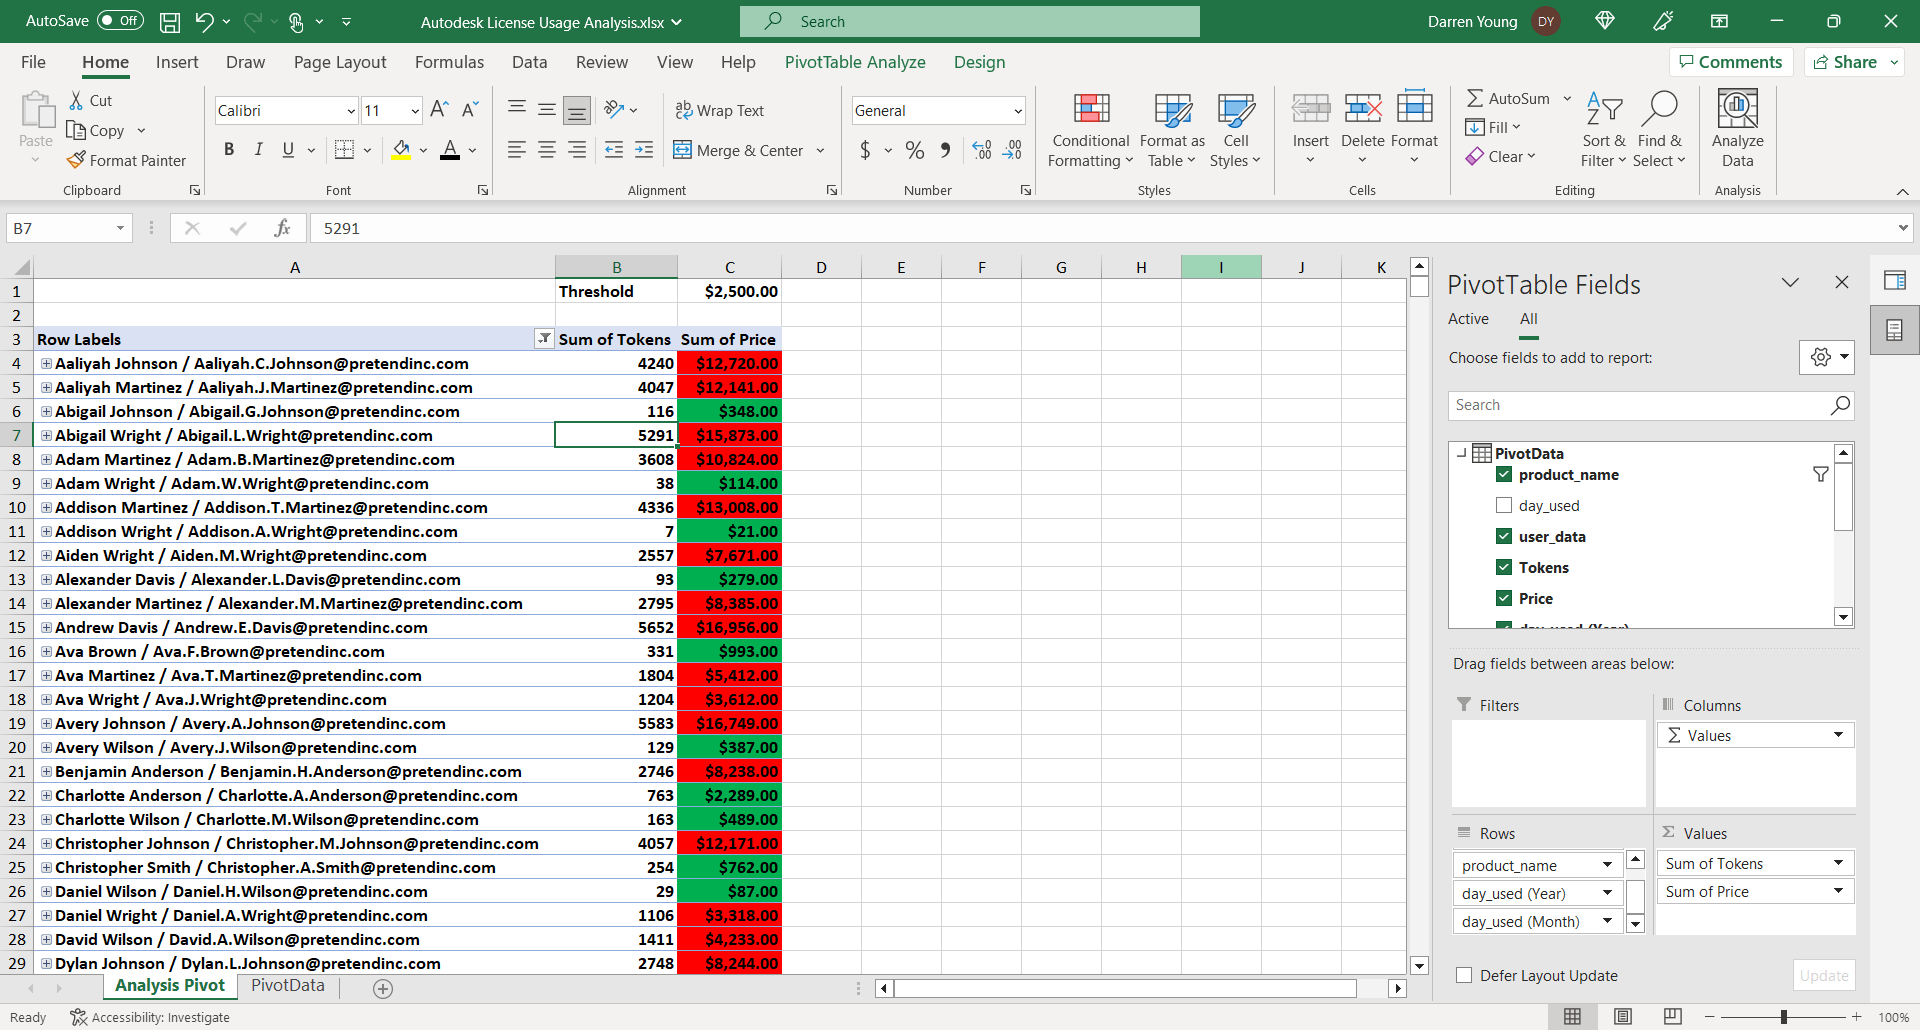
Next, I collapse all the data in the Pivot Table down to the user level (1). This was shown earlier in Step 28. At this point, you see the yearly total for all users in terms of both Tokens Used and the Price you would have paid if those users were theoretically on the Flex licensing model over the last year.
As you can see, Flex is a much more expensive licensing model for users who would be full time. The cost in the US for a full AEC Collection license is about $3000 annually. So anybody under that price would have been cheaper on Flex…maybe. Remember that “2 for 1” Network trade in Autodesk did? Those license are discounted significantly. Those discounted prices nee to be taken into consideration too. You may have users cheaper on Flex if they had a full dost license, but not if they were using a discounted license.
To help me run these scenarios, I add a Threshold price at the top (2) that I can plug a target number I’m looking to compare against. A new AEC Collection is $3000 so I build in a safety margin and use $2500 as my number. Anyone under $2500 I move to Flex. But I can also put in $1200 and see how somebody would compare to a discounted license.
Step 32
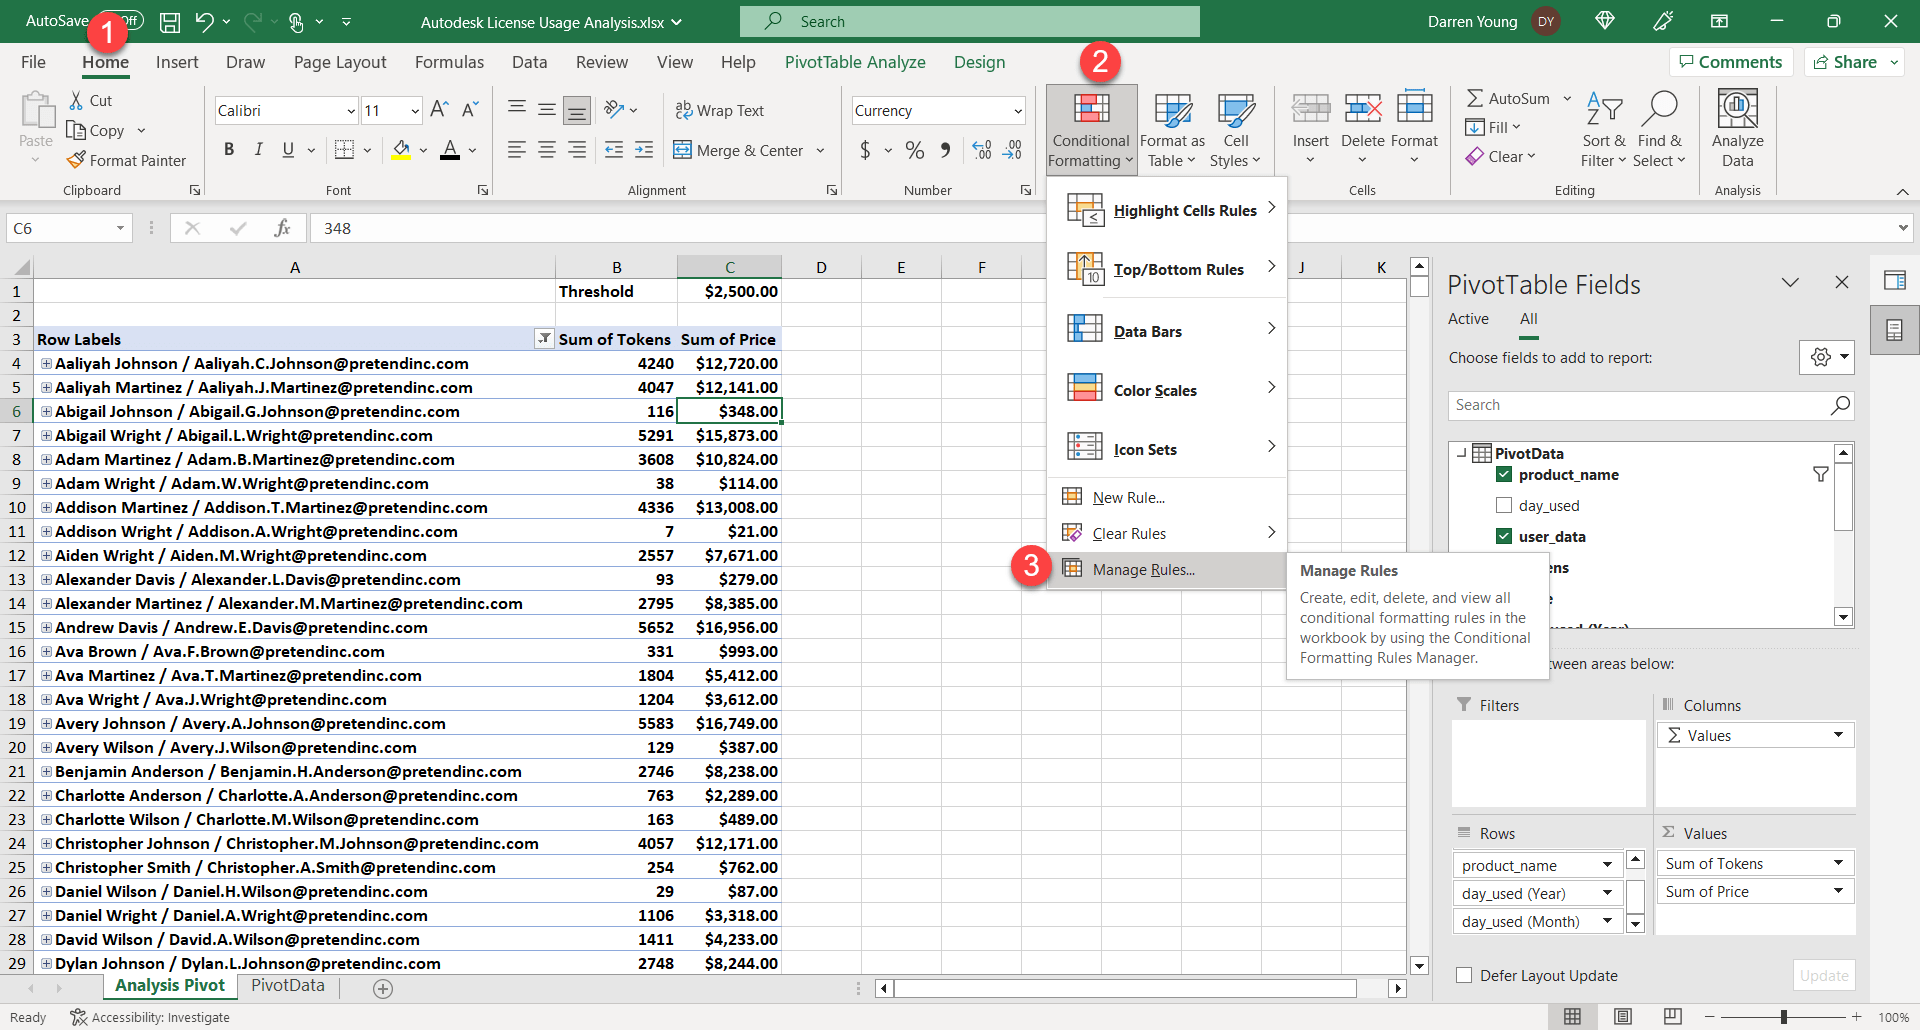
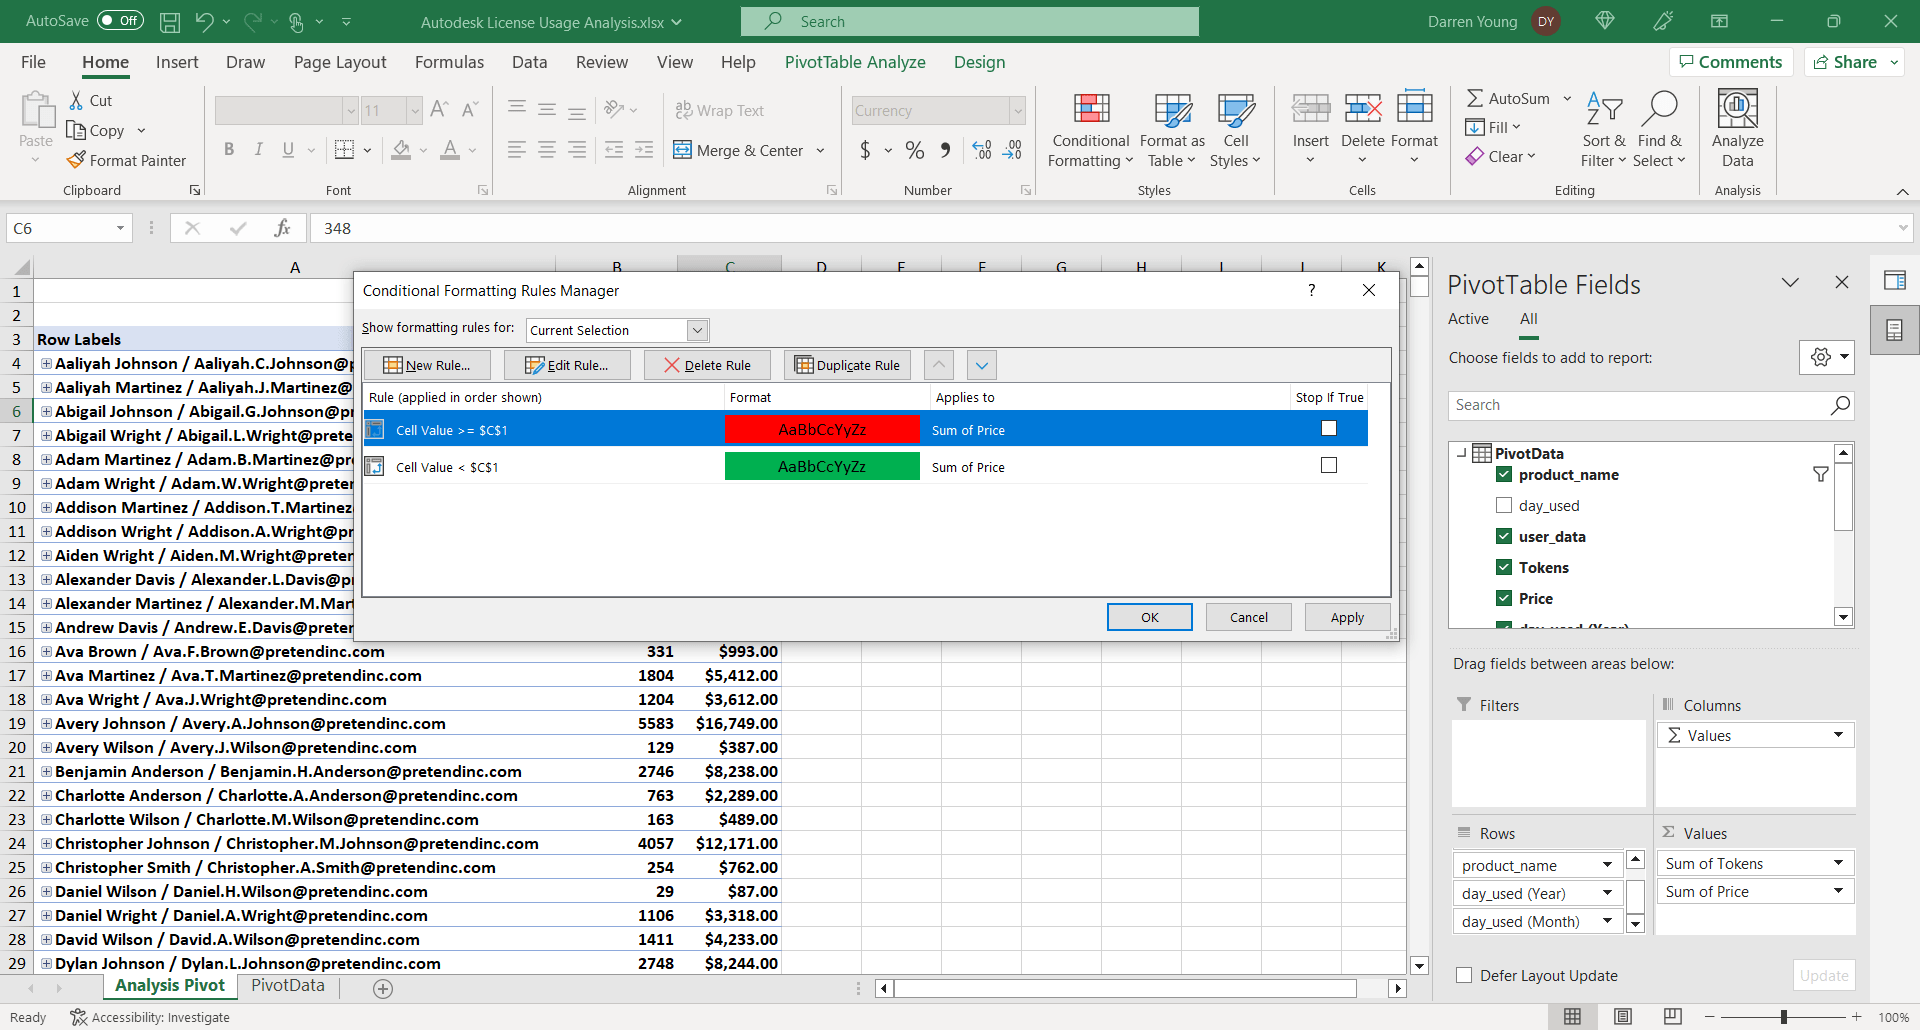
The last little “nice” thing I do that’s not required uses the threshold number I entered earlier. I then use Conditional formatting to color the values to more easily see what should and should not got to Flex.
Select Home (1), Conditional Formatting (2)then Manage Rules…(3)
Step 33
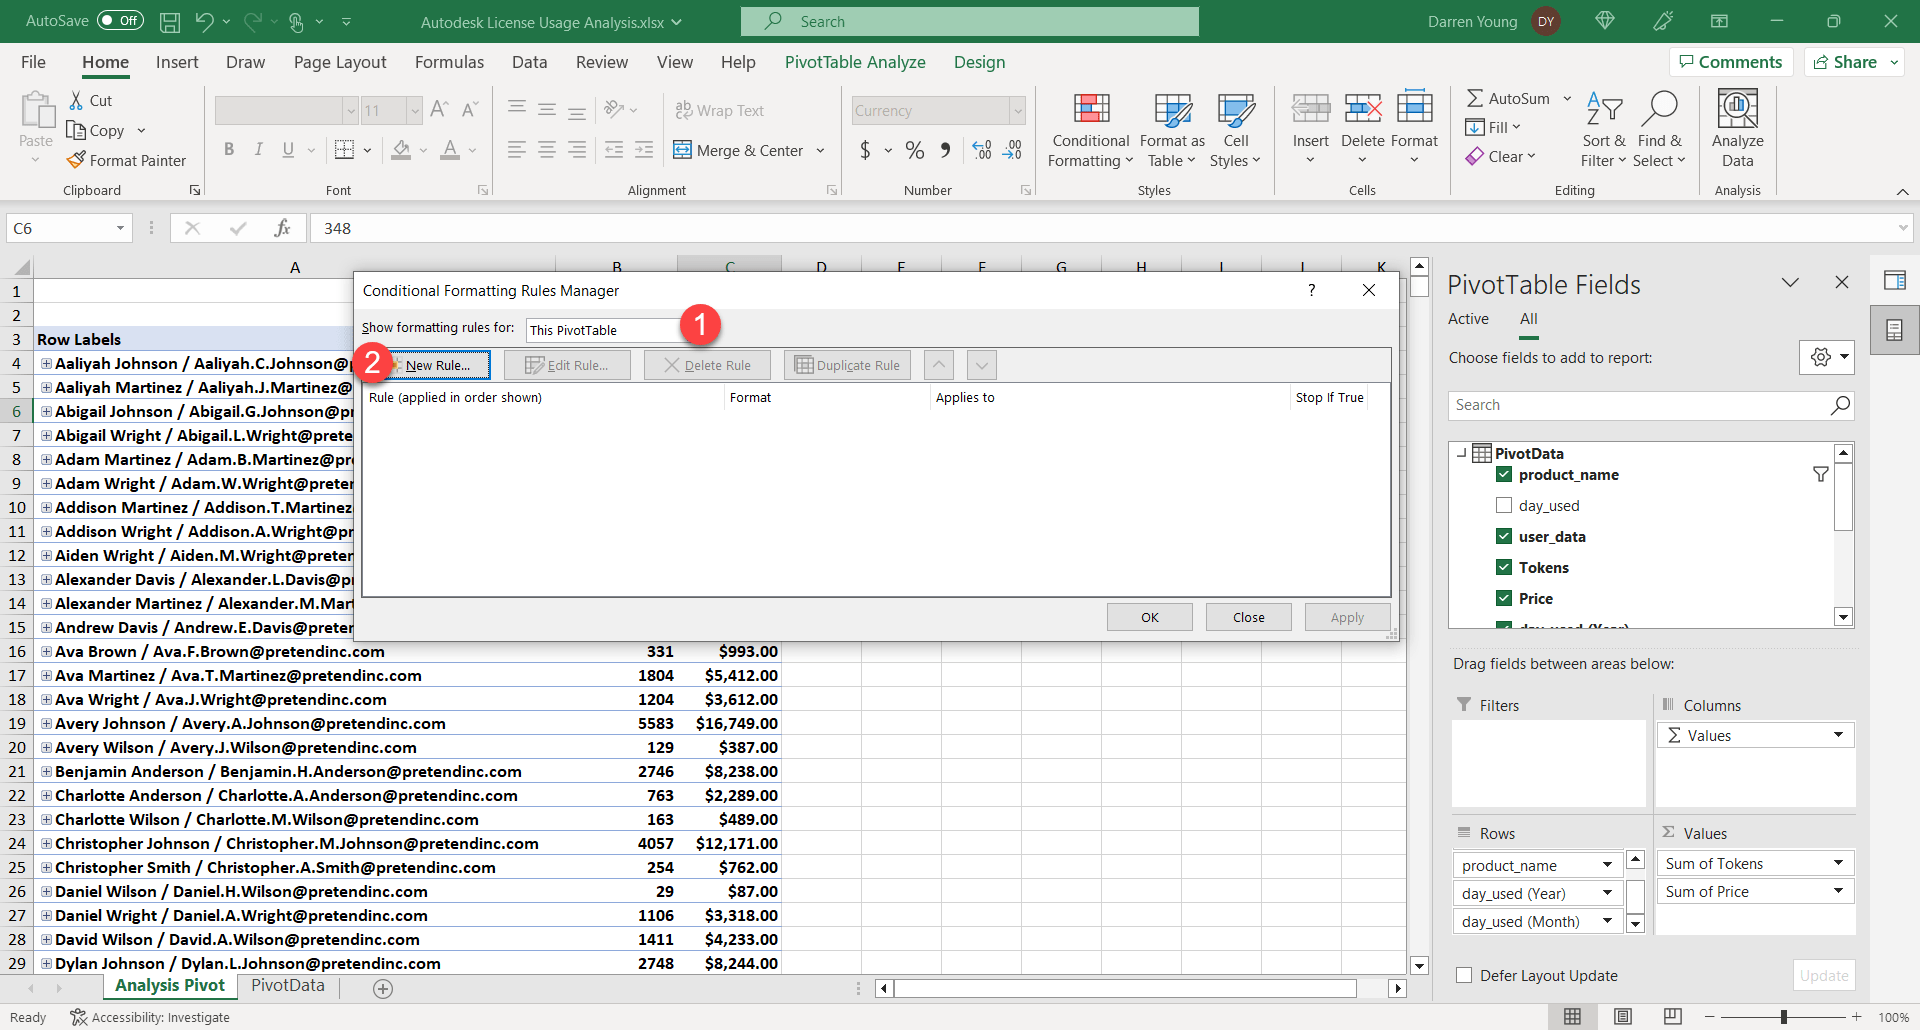
In the Conditional Formatting Rule Manager dialog, make sure This PivotTable (1) is selected from the dropdown and then click New Rule (2).
Step 34
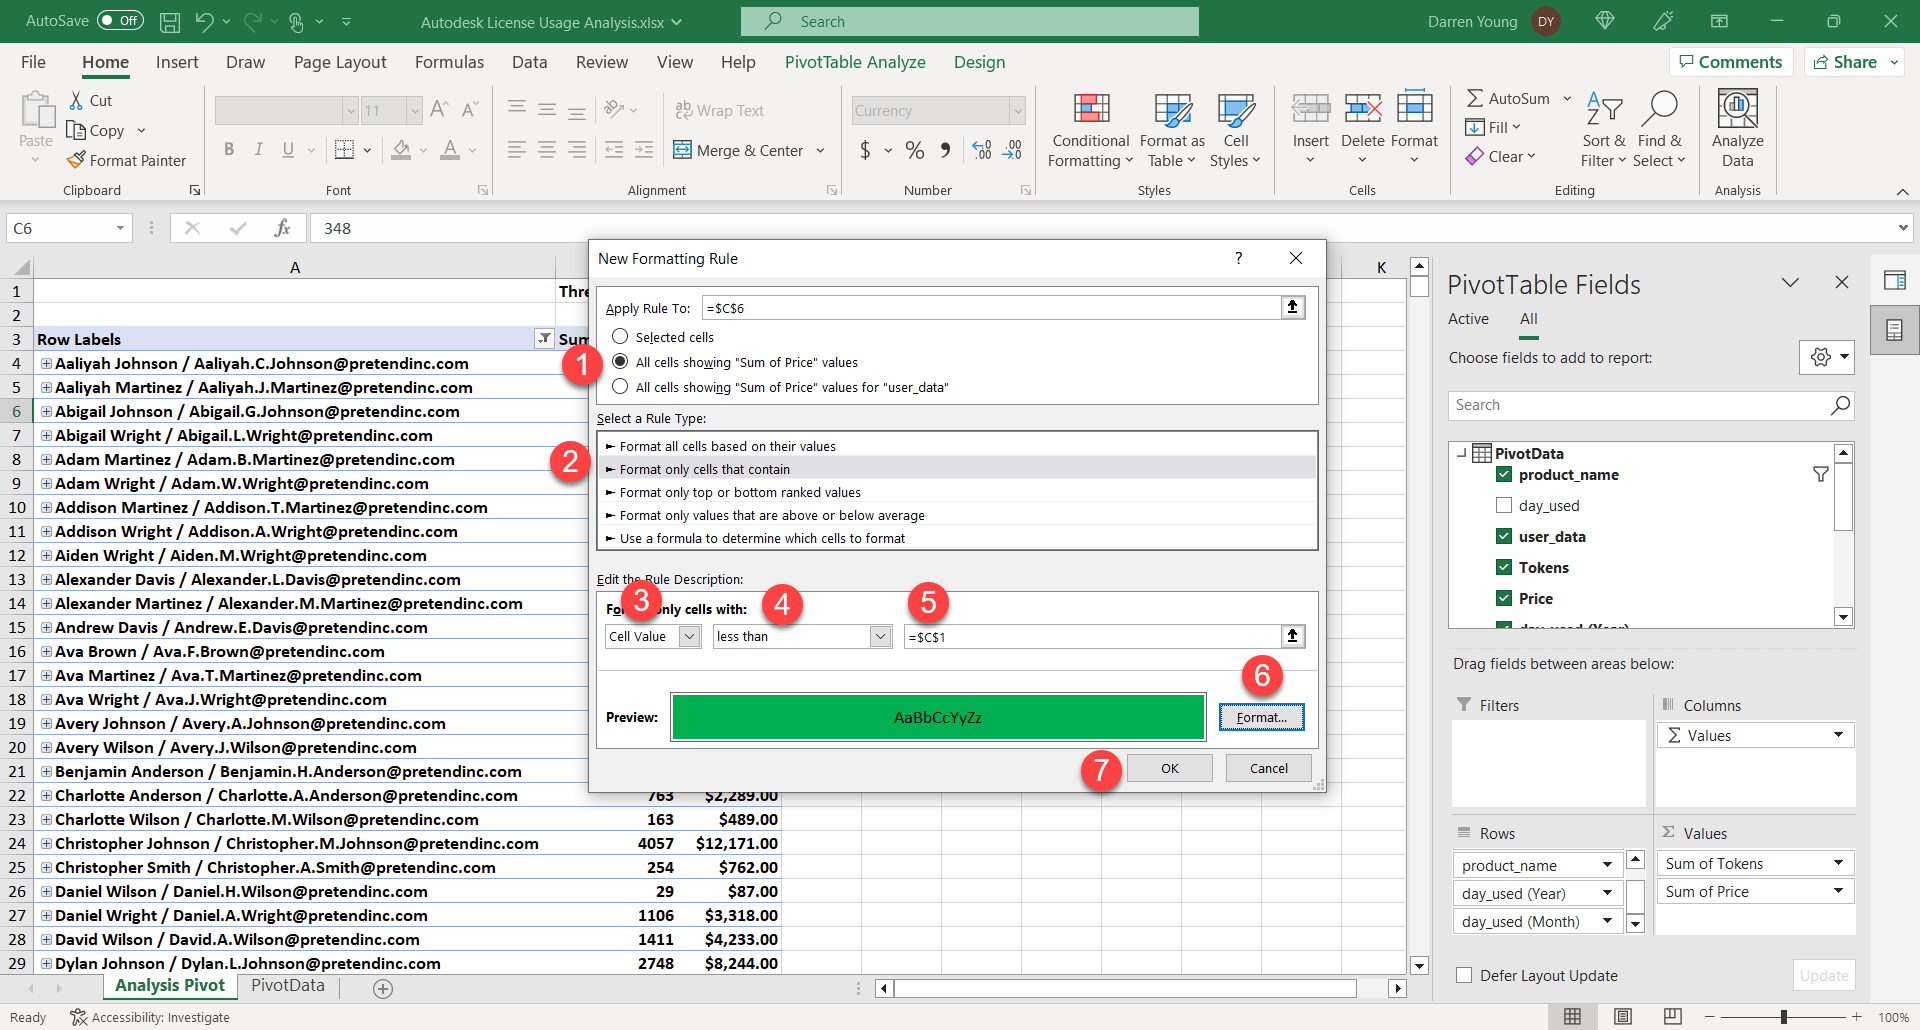
In the New Formatting Rule dialog, select All cells showing ‘Sum of Price’ values (1), then Format only cells that contain (2), next set Cell Value (3) to Less than (4) for the cell =$C$1 (5) which is where you place the Threshold value you want to use. You can then change the Format (6) to Green and click OK (7). This will highlight all cells below your Threshold value indicating they’re likely Safe to move to a Flex license.
Repeat Step 33 and 34 to make another rule but change it to Greater than or Equal to (4) and the Format(6) to Red then click OK.
Step 35
When you’re done, your rules should look like this. Click OK.
Step 36
You’re done! Your data should look like this. You can now play with Filters, the Threshold dollar amount you want to use as your reference. You can even expand in and drill into each users data. Play with the Pivot Table values and experiment to get the data how you want.
Summary
Hopefully this was helpful. I was able to save over 30% on my Autodesk renewal this year by analyzing license usage by performing the following…
Check which users can switch to Flex.
Count dedicated license users who can’t move to Flex.
Buy 75% of the tokens needed for the Flex users.
Drop unneeded full cost product licenses.
Retained unneeded discounted licenses
Eliminated products completely if Flex covered all user needs
I kept extra discounted licenses from the 2-for-1 trade-in, which offer deep discounts till 2028. It’s hard to find discounts, let alone multi-year ones, so I believe these will cover future full-time user growth.
Some other companies I spoke with have also reduced their desktop software licenses by almost 1/3, using Flex for part-time users.
To run analysis using new data, just overwrite the report with the new data in the same format. Then, open your analysis spreadsheet and refresh all queries and pivots. I hope this helped you save and learn some Excel Power Query! Good luck!
Autodesk University 2022 is a wrap. First live event since 2019. This year, it moved from Las Vegas to New Orleans. Folks had a lot of mixed feelings about this event. Including victimization of some attendees. I won’t rehash what someone else has done so for a good review of how the “Event” went, give this 20 minute recap a watch. Neil Cross does a bang up job recapping this poorly organized event. https://www.youtube.com/watch?v=StEtDbUxHV0
New Orleans – The City
I’ve been to New Orleans before. Stayed at the same hotel in fact. New Orleans Hilton Riverside. It was about a decade ago. Really enjoyed the city so I was looking forward to going back.
Honestly, I really like the city….much more so than Las Vegas. The Architecture is amazing. Neighborhoods rich with character and culture. Great music and most of all, some of the most amazing food I’ve ever had. I find the people in general are warm and kind. I think my ride from the airport was the the best Lyft ride I’ve had of any city. Linsey was a pleasure to converse with during the trip.
While my Monday arrival was warm, the weather the remainder of the week was pleasant. A result of Hurricane Ian pulling cooler air from the north. I think we lucked out that it wasn’t hotter and more humid.
Now while I personally like the city, it is well known as a corrupt and violent city. If you listened to the video link above, you’ll know this crime affected several attendees. People drugged and mugged. Robbed at gunpoint and knifepoint. One attendee was stabbed. Even the legendary God Father of Autodesk Fabrication CADmep had someone try to pick pocket him. You can see his post here.
Knowing all this, I would go back to New Orleans…the city. Perhaps I’d view it differently if it happened to me. But while I grew up very rural, I did grow up with a lot of violent crime. By the time I graduated high-school I’d had over a dozen connections with people being killed. While I don’t make excuses, I do have an understanding of the effects of poverty. Perhaps that’s why I still felt comfortable in New Orleans. I grew up around people like this. The good and the bad. Frankly, I felt WAY more safe walking around in New Orleans than I do in Seattle. For me, New Orleans is an upgrade. Your mileage may vary.
New Orleans – The Convention Center
The New Orleans Convention is the 6th largest in the US. Despite that, I don’t think it was built to host a single large event…rather multiple smaller events at the same time. Halls were narrow leading to over crowding. 20 minute line to get up the escalator the first day. Remaining days people seemed to self adjust.
But the convention center is LONG and narrow. Not stacked like in Las Vegas. Took forever to get anywhere. With room attendants not letting people in early, it led to even more crowded halls.
Even the rooms themselves were typically smaller. Much harder to “Sneak” in or out if the class wasn’t what you wanted. A more frequent even this year than most.
While convention center food is never top notch, even in Las Vegas, it was particularly low quality here. A surprise considering the quality of feed elsewhere in the city. One morning, the breakfast burritos were so starchy it made a McDonalds seem like a Michelin 5-Star Restaurant.
Bottom line, if they continue to have AU at this convention center as it’s rumored to be, it’ll have limited success. This just is NOT the venue to host Autodesk University IMO. The facility and services are just not up to par.
Expo Hall
Expo hall was what you’d expect. I’d venture to say half the space was utilized by Autodesk. Mostly wasted IMO. There’s only a couple places where I’d typically go to meet the product teams. The rest is of no value to me. Taking meaningless surveys or other low value activities Autodesk marketing thinks are worth while. Letting users think they’re impacting direction while nothing meaningful changes. Nothing that’s going to improve your professional life IMO.
Expo hall ran out of food within the first 30 minutes of lunch on the first day. No refills of the buffet tables like you see in Vegas. As lunch started 1/2 hour before the General Keynote ended, everyone came out to an empty food line. This means the remaining days people left the Keynotes early to ensure they were fed.
One disappointing thing was finding the UA’s Trade Exhibit was micro managed. They wouldn’t let them operate much of it. GTP’s Stratus booth was right down the row. Both with people walking by not quite getting the connection unless you were from the MEP Trades yourself. Not sure if this was the Convention Center Legal or Autodesk Legal but it was a missed opportunity in my estimation. Especially considering a few years back Titan’s of CNC were throwing chips from their CNC equipment. Had they showed the Tigerstop running from Stratus and hearing the buzz of copper or PVC cutting….it would have drawn people to the back where they were stuffed and really connected the dots IMO.
For the most part, any booth worth seeing was hard to see as they were very busy. I tried going to DiRoot’s both multiple times only to find them overwhelmed with interest. Other booths seemed pretty slow. I stopped by one booth from a vendor from Finland. After 15 minutes of a demo and them talking, I still didn’t know what they hell they did or what he was saying. Ironic considering I grew up in a part of the Michigan listening to Suomi Kutsuu (Finland Calling) on Sunday morning television as a kid. The US’s only Finnish language programming.
Classes / Sessions
Sessions this year were absolutely abysmal IMO. That said, the speakers were generally high quality and presented well. It was just the topic selections were utter rubbish. To the point I almost didn’t bother attending AU at all. Ultimately, I remembered that its the networking and face time w/Autodesk product managers not the classes that have me coming back.
Still, every AU there’s some good classes. This year, anything worth taking was full. As one long time Autodesk University speaker told me, they’ve never had their sessions repeated before. Their take was there was nothing worth taking so everyone signed up for theirs.
Another former coworker texted me…
“I felt Tuesday sessions were sub-par so went on a walking food tour of the city instead”
I ended up either skipping or walking out of all but 4 of the sessions I had scheduled not counting the panel I was on.
In years past, a group of industry insiders would help select sessions. This year, I’m told it was Autodesk Marketing. This meant that most sessions were beginner or sales focus. As Neil Cross put it…”Thought grandstanding”. Even the descriptions were misleading on many. This is the type of tone many set…
“As a company, it’s our mission to help solve the global climate crisis…..” followed by a lot of nonsense and the last sentence being something like “Learn how we use Autodesk Docs”.
Part of the problem is also the session “voting” after the original RFP’s. Those self promoting their sessions with a large LinkedIn network get voted up vs. voting merely based on merit. I was added to an Autodesk Panel at the last minute this year. None of my proposals were selected. I’m ok with that. I actually don’t like “teaching” the sessions. I do it as I feel it’s important to give back to an industry who’s helped me. If others don’t feel my content is worth while, I’m ok not teaching. But the way some instructors self-promote…they’re clearly in it for their ego in teaching at AU and less for the attendees. I think this contributes to a decline in session quality. You really want someone’s session selected because their Grandma voted it up?
If you look at many of the sessions, clearly the San Francisco Bay area “Woke” crowd and Autodesk Sales Idealism was who and what Autodesk Marketing was targeting. Here’s some of the key phrases you saw littered about the titles and descriptions….
Not that these aren’t good topics….but this is a Tech conference is it not? It’s now primarily a “Beginner” and “Sales” conference. Very little on how to actually do things. A session of how the software/services can fall short and what to do about it is clearly not on the table any longer.
And lets get real…after 2-1/2 years…we’ve all figured out how to remote work or we’re likely out of business. We don’t need another class on Remote F’ing Work.
All I can say is that if you attended half of this crap, you were are guaranteed to be well prepared to solve everything from World Peace to Feline Leukemia this next year.
Oh, and not to mention, there were no computer labs. Given they handed all registrants a Covid tests to self-report, I can only assume the lawyers shut down the hands on labs.
Reviewing My 4 Good Classes….
As I said, there were 4 sessions I didn’t walk out of. I’ll review them here….
This session was presented by Mark Flayler of IMAGINiT. Mark did a fantastic job explaining the options for Revit and Inventor interoperability and how it’s changed over the releases. If you’re working on toward industrialized construction or manufacturing for construction, this session is a must.
While Inventor and Fusion 360 don’t have the user base programs like Solidworks have, you’re just not going to be able to touch the functionality Inventor has with Revit interoperability. You need to reference Revit inside Inventor to design something going into a building? It’s there. Want to export what you designed in Inventor to use in Revit? It’s there.
If you’re doing fabrication or manufacturing drawings and models outside of Revit for construction, you need to review this material. That said, Fabrication Parts in Revit don’t import worth a shit inside Inventor. That wasn’t discussed in this session rather that’s my contribution. But for everything else, it should work great.
This session was presented by Robert Manna of dRofus and James Mazza of Stantec. If you read up on any of Autodesk’s big announcements regarding their rebranding Forge to Autodesk Platform Services, this session was a good preview of the direction Autodesk is headed regarding your design data. Robert and James gave a great overview of how you’d go about using the Data API’s.
Not a coder? No worries. This session wasn’t full of syntax and code snippets. It was higher level discussion how you would use the API’s not demonstrating actually coding them. If you’re not a coder, there was still a lot of value here IMO.
This session was presented by Eugen Taranov and Melanie Thilo both of Autodesk. It covered the topic of Model Based Definition. As Manufacturing typically leads a lot of trends you see in AEC by 2-3 decades, I’m always game for a good Manufacturing session.
If you’re new to MBD (Model Based Definition), it’s about embedding the manufacturing data within a model so that it can be fabricated without a human needing to read a drawing.
What interested me about this session is that I’ve long stated that I thick AEC is headed the wrong direction be jamming every piece of data within a 3d model. Revit is not SQL server after all. You can read one of my prior posts here about this. MBD seems to contradict my view of where AEC is headed. As such, it created a dilemma in thinking that I wanted to sort out.
Having sat through the session, I now have a more firm view of MBD and I don’t see any conflict with my thinking. MDB isn’t about embedding ALL data within a model, rather manufacturing specific information that needs to be communicated. My view that AEC is placing TOO much data within models is not in conflict with MBD in my eyes.
One realization I came to is that MEP is already doing “Lite” versions of MBD with tools like Stratus, M-Suite, Allied BIM and Connect2Fab. I say “Lite” because MEP doesn’t need high-precision tolerancing descriptions like GDT or finish information communicated the same way manufacturing does. None the less, it’s important to realize it is a form of MBD which is a validation on the direction we’re headed. The only real disappointing part is Autodesk themselves is not enabling Digital Fabrication for MEP. They’ve done their best to fragment the workflows and it’s 3rd parties providing these services. Most of the fabrication data Autodesk creates for MEP is not even accessible in Revit and is completely ignored in the Construction Cloud let alone their Industrialized Construction initiatives.
This session was presented by Claudia Calderon Quintero and Josh Churchill both of SSOE. This was literally the ONLY session at AU that covered anything related to Autodesk Fabrication. I wasn’t expecting much. Autodesk Fabrication has a pretty tight knit community of experts who’ve known each other for decades. Anyone speaking on Autodesk Fabrication that isn’t a known name is highly suspect.
That said, I was very surprised at this session. From an A&E perspective, they covered the topic very well. I’ve listened to Autodesk Fabrication presentations over the years with a lot of partial or incorrect information. But Claudia and Josh had a really rock solid presentation. Everything I heard was detailed, accurate and presented very well. I’m really impressed as well in their ability to get up to speed with Fabrication Parts as it’s not an easy thing to learn on your own when there’s not a lot of resources.
The essence of their presentation was using Fabrication Parts to create a “Specification” for industrial or process piping. As they said, anyone can make a “fabrication” level model with Revit Families…but anyone can also mess with those families. By using Fabrication Parts in Services, it get’s Revit a lot closer to a “Spec” driven design like you’d typically see in industrial piping with Plant3d with the content a little more protected from incorrect manipulation.
The key learning point here for me was the value of Fabrication Parts for a firm who’s NOT actually fabricating. I’ve struggled to see the value of Fabrication Parts for an Engineering only firm. Claudia and Josh easily explained this value to me. Something that having my head stuck in the actual “fabrication” and “construction” prevented me from seeing. Great job and great class.
Things We Can’t Do
Despite all Autodesk’s self proclamations of greatness and the legions of fans, there’s more holes in Autodesk’s strategy than a block of swiss cheese if your an MEP contractor. Here’s a few highlights of my observations from an MEP Contractor’s perspective….some will apply more broadly to other trades/domains.
Industrialized Construction, Inventor and Revit
One of my highlights of Autodesk University is to see the “Manufacturing Informed Design” team at Autodesk in the Expo Hall. I’ve spent 30 years straddling Construction and Manufacturing asking for this. It’s finally coming. Everything Autodesk has done to date seems to have been “Design” focused….pushing unbuildable design to Fabrication, Construction and Manufacturing. The Manufacturing Informed Design group flips that around…putting the PRODUCT front and center. This allows the Manufacturer or Fabricator to control how their product is used in Design….the way it always should have been.
Sure you can make a Revit family that represents a product. But anyone and everyone can mess with the RFA. You’ve can’t receive this model back and have any sense of reliability that’s it’s something you can manufacture from. What the Manufacturing Informed Design team does, is to make sure nobody in Revit can mess with your product. If your product is configurable, the consumer (Designer) is directed back to Autodesk’s web portal where they can control ONLY the aspects of the product the Manufacturer allows.
While the initial release will focus on Products produced in Inventor, there are plans to expand the “authoring” to other platforms like Fusion 360, Revit…perhaps even Solidworks and others. They want to make the logic authoring agnostic using code blocks similar to Inventor’s iLogic for configuration. In my opinion, this is the single most important step they could make toward “Productization” in construction.
So what’s the catch? Beta is estimated to be next year. That likely means 2024 Revit will be the first version (if not later…or even at all) that will have this capability. Except that means we’ll realistically be able to use this about 2027/2028. This industry loves to stay on old Revit versions and Autodesk now allows use up to 5 versions back. This means it’ll be 2028 by the time you find defects or functional limitations of 2024 versions. Except they won’t fix 2024 four years later…those fixes will come in 2029/2030 versions which you’ll start using about 2033/2034. That’s a 10 year development/feedback cycle. It’s just not sustainable. Keep this in mind when they tell you the industry is going to completely transform to products within a few short years. The tools just aren’t there to facilitate this in a wide scale manner.
Industrialized Construction and Fabrication Parts
As you can tell from the Inventor/Revit interoperability class I reported on earlier and the Manufacturing Informed Design group’s initiatives…Inventor is a key part of Autodesk’s Industrialized Construction Strategy.
Except that the vast majority of large MEP Fabricators are using Fabrication Parts. Fabrication Parts can be exported and brought into Inventor….except they look like shit and are unusable for manufacturing in the Inventor environment. Inventor and Fusion 360 are Solid Modelers. Fabrication Parts are NOT Solids…they’re surfaces. Poor quality surfaces at that. That was intentional…to keep AutoCAD/CADmep performant. Because Fabrication Parts know what they are (Pipe, Elbow, Tee, Valve, etc.) they have the proper data to fabricate from and don’t need heavy detailed graphics. You can place 10x more Fabrication Parts in Revit than RFA’s before seeing the same performance impact.
Until Autodesk bolts Fabrication Parts into Inventor (and I have no knowledge they’re even considering this) you’ll have to wait for the Manufacturing Informed Design team to allow Revit Authoring of Product. Who knows when that will be and when it does happen…what are the chances they even know how to manipulate a Fabrication Part? Most of Autodesk’s own Revit experts don’t even know what a Fabrication Part is let alone comprehend their value. Of the hundreds of data points Fabrication Parts hold…even their own Construction Cloud knows virtually nothing of the data. In short, the firms who have digitally fabricated from 3d models for nearly 30 years (MEP Contractors) are largely shut out of all Autodesk’s Industrialized Construction technology strategy.
Speaking of Fabrication Parts…
I asked about the MEP Fabrication Data Manager Sync. The Technical Preview of Autodesk’s Cloud based Fabrication configuration manager. A 7+ year initiative that’s still not usable in any practical capacity. I asked when it would be “Done”.
“Who’s to say it’ll ever be done. Perhaps it keeps evolving.”
Fair enough. So I followed up…When will it evolve enough that MEP contractors will willing use it?
“Who’s to say it’s even going to be for that type of customer?”
That speaks volumes. Add to that the ONLY session at Autodesk University on Fabrication Parts in Revit was from an A/E firm that doesn’t build or fabricate, it’s another data point suggesting Autodesk doesn’t have a plan for MEP Contractors. Or they simply think they’ll all cease to exist in a “Productized / Industrialized” construction economy. Certainly MEP Contractor’s will need to evolve…but we’re not going away. Great opportunity for someone else to enter the market IMO.
Data Exchanges
Another focus of Autodesk is Cloud Enabled Data Exchanges. You don’t download or export a spreadsheet to order from Amazon.Com or to book a flight. This makes a lot of sense in many if not most ways. It’s the first step of breaking down those old obsolete concepts and barriers like “files” which have long outlived their usefulness. With so much work to do in this area, it’s unlikely Autodesk will make Fabrication Parts part of these data exchanges anytime soon….if ever. Products like GTP’s Stratus jump through huge hoops to mine the data they do. These exchanges aren’t anywhere close to possible in Autodesk’s Platform Solutions today. It’s my hope that these Cloud based data exchanges evolve enough to start breaking down those “version incompatibility” walls between Revit versions which will shorten that 10-year development cycle. At least that’s my hope….if I were to have any.
A Bridge to Nowhere
One of the Autodesk Construction Cloud (ACC) highlights is it’s “Bridge” functionality. It allows you to link/sync multiple ACC Accounts between customers. Except that it only works on “published” models in Docs. It doesn’t work on “Live” models with BIM360 Collaborate Pro like it needs to. It also doesn’t work on the “Data”, just the “files”. This limits the effectiveness of ACC which is why most BIM360/ACC projects I see are complete train wrecks in terms of their use of existing functionality and configuration. People using Desktop Connector to access non-collaborated models or host Central Workshared models that aren’t in Collaboration.
Rumor has it Autodesk is reworking Desktop Connector. I’m sure that’ll inject just as many problems as it solves. Autodesk simply doesn’t have robust feature sets in their products any longer. Merely enough features to keep you on the hook as they have guaranteed annual revenue now.
Future Speculation
Given everything I’ve seen and heard….and 30 years of observing the industry and correctly predicting much of what has really transpired, I have a few predications…
Autodesk’s Cloud enabled Exchanges will eventually be monetized. You’ll pay for everything eventually. Pay to author…pay to report…pay to export.
Autodesk will become the “Facebook” (Meta) of Design/Construction/Manufacturing data. That means everything you think of when you think Facebook….the good and bad.
An API first strategy is NOT in the cards. Data Exchanges will always be limited compared to what Autodesk can do with them. This will allow them to control and maintain their market position limiting what others can do or and controlling how much they must pay.
Old school data exchanges will eventually go away and everything will be required to use the Cloud to facilitate data exchanges. I don’t like it on principal but it makes sense and needs to happen.
3rd party developers traditionally thought of as Autodesk competitors will some day be customers to facilitate their interoperability with Autodesk.
Industrialized Construction will not be as wide spread or come as quickly as Autodesk says. Autodesk will be the biggest limiting factor in this due to products suffering a drought of features and depth.
No need to cover the positive predictions….I touched on them earlier and Autodesk does a good job promoting them all on their own. They don’t need my help. My value is providing a more realistic perspective and timeline….IMO. Let’s hope I’m wrong on many of my predications.
Autodesk’s Remote Entry can be installed on any number of computers without cost just as long as you have at least a single license of Fabrication CAMduct (~$1000/yr). You can read about Remote Entry’s licensing details here. Remote Entry is only of value if you’re shop or your duct manufacturer uses Autodesk’s Fabrication CAMduct to drive fabrication.
Note, like most of Autodesk’s Fabrication software…this is a stagnant product. Works only on Windows (no Andriod or IoS). Unless you’re already using CAMduct in your shop, there’s littererly very little reason to ever implement this software.
BuildCentrix
BuildCentrix started out as Webduct. They’ve since expended beyond ductwork and gone as far as having capabilities to integrate with a number of ERP systems. This is likely the best “Enterprise Class” tool focusedon ductwork at this time.
FieldOrderZ
One of the newer players in the market, it’s a project partnered with GTP. However you don’t need to be a GTP Stratus user to leverage FieldOrderZ. It can serve your needs even if you’re not a Stratus customer. It can also facilitate more than just Ductwork. Works best for Autodesk Fabrication users but I’d encourage you to reach out to them to see what they can do if you’re not an Autodesk Fabricatino customer. Likely one of the easiest tools for your Field staff to sketch what they need without being an AutocAD or Revit savvy detailer.
SiteTrace
SiteTrace is another newcomer I’ve just become aware of. CAD Content agnostic, it’ll help digitize your field ordering of Duct and related accessories saving you time and errors from traditional processes. They don’t integrate with any CAM software or Machine tools at this time making it the perfect fit for those smaller shops that get overlooked by the larger software companies.
Trimble FabShop
This is the old Vulcan software, one of the long timer CAM platforms for Duct fabricators. Their current platform has mobile capabilities that allow Field ordering of duct and processing within Trimble’s Shop Fabrication software.
Vicon Vi-Call
Most pepole know Vicon as a builder of Duct fabrication machinery. But they also offer a varierty of software tools. One of which facilities ordering of ductwork from your field staff to the shop into their managment platform.
If you’re aware of other field ordering tools for Sheetmetal ductwork, drop me a note and I’ll get them added to the list.
I see a lot of people confused about how BIM360 Docs / Autodesk Docs works when used with BIM360 Design or BIM Collaborate Pro and Revit. It doesn’t help any that Autodesk repeatedly refers to ‘Single Source of Truth‘ as one of the benefits. While BIM360/ACC does help provide a ‘Single Source of Truth‘, it’s not quite as simple as it seems.
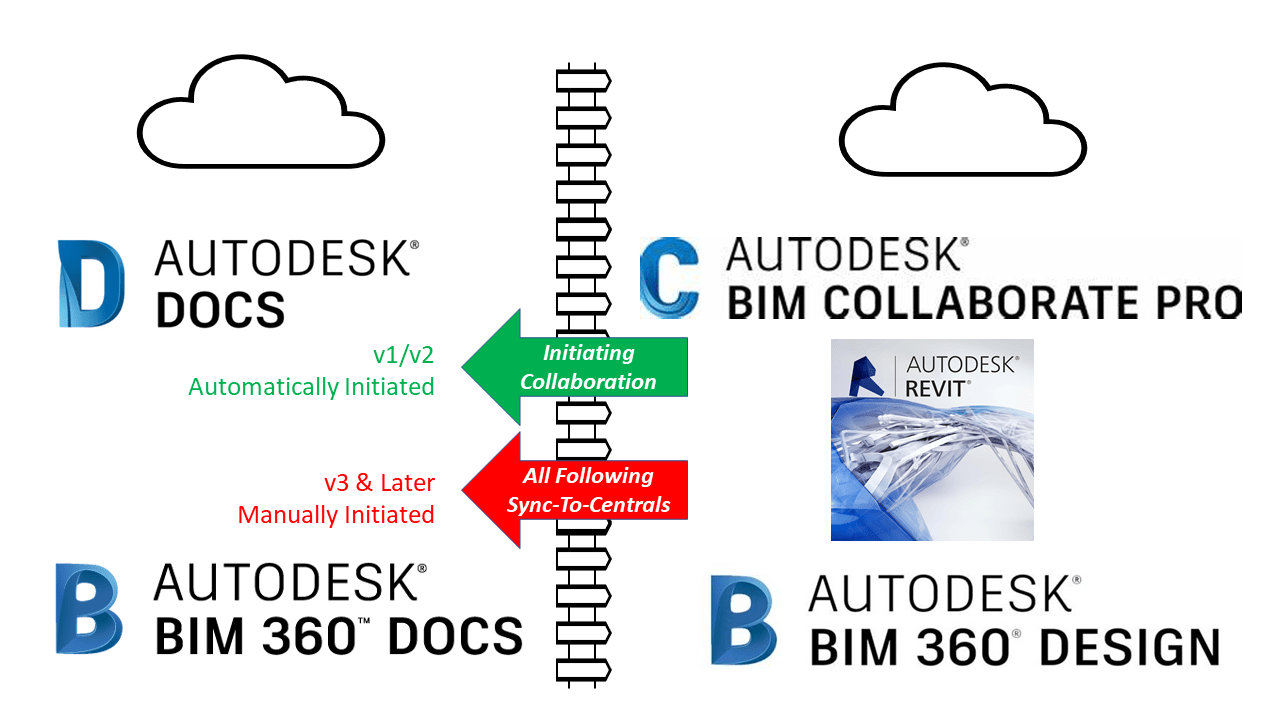
There’s 2 Models…Not 1.
Yes, you heard me right. There’s actually 2 models and a virtual ‘Fence‘ between them. One used by BIM360 Design / BIM Collaborate Pro and another completely separate model by BIM360 Docs / Autodesk Docs. This graphics might explain it a little better…
How Things Really Work
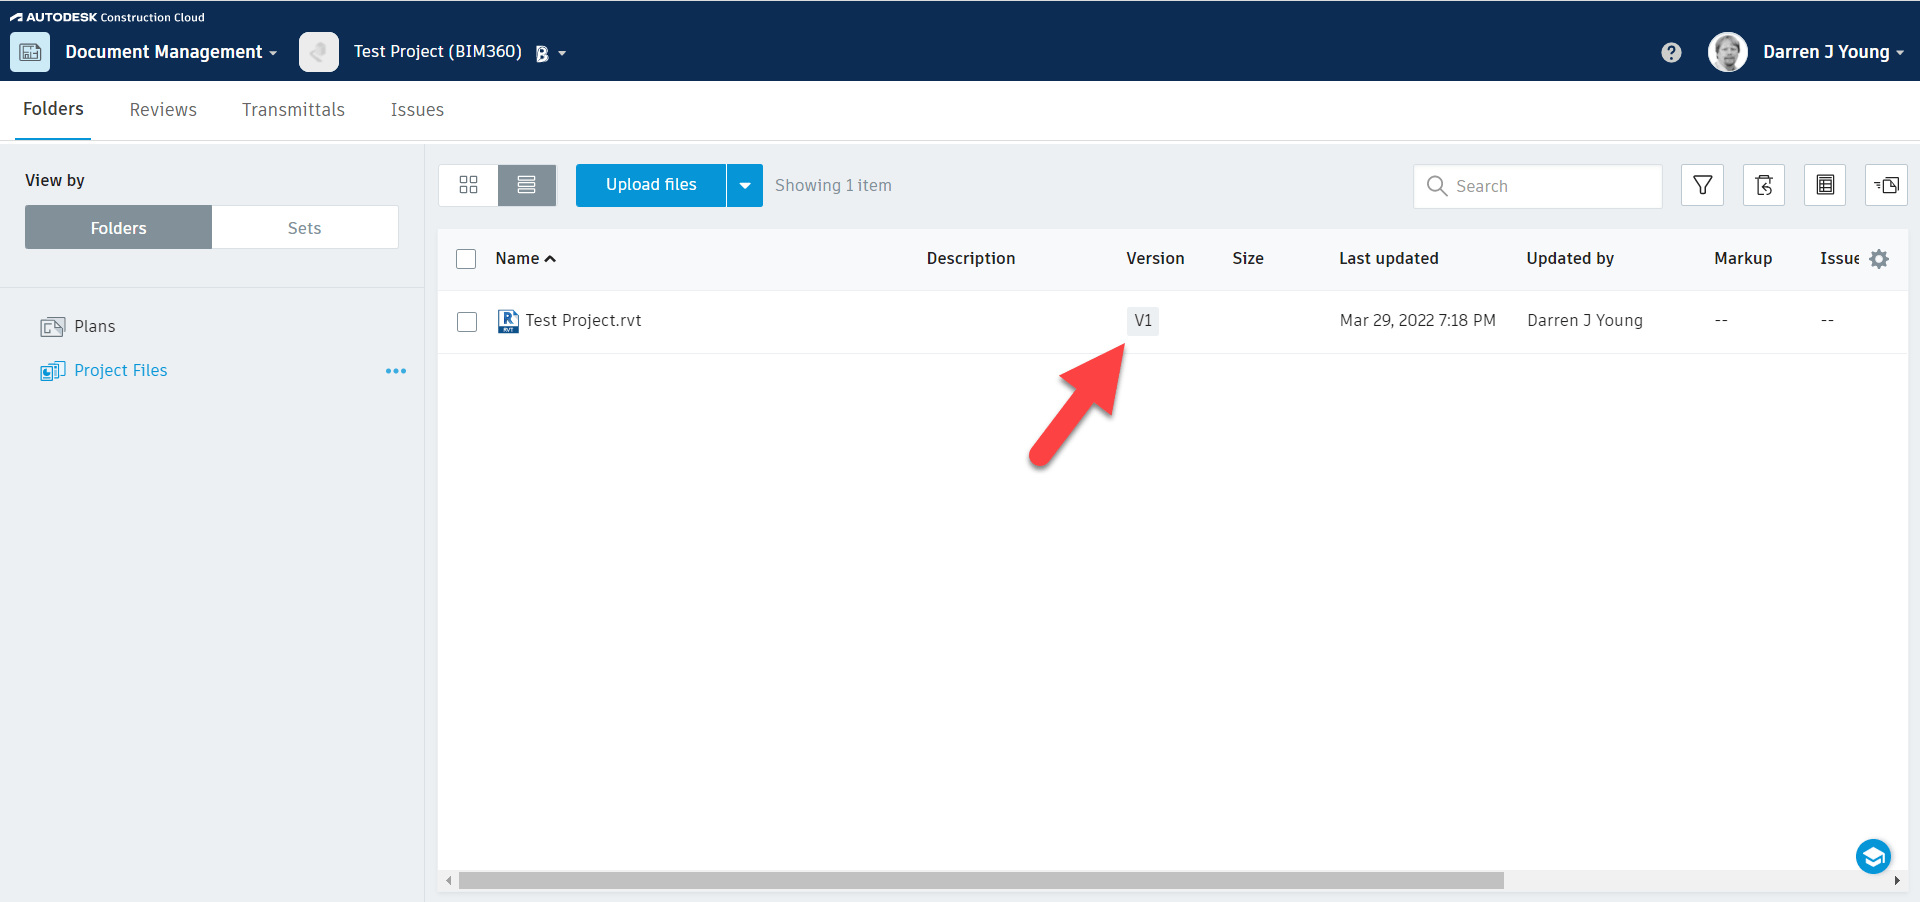
Before anyone creates anything, Docs has no files. The following images show BIM360 Docs on the feft and Autodesk Construction Cloud on the right. This will help you see subtle differences however things really work the same.
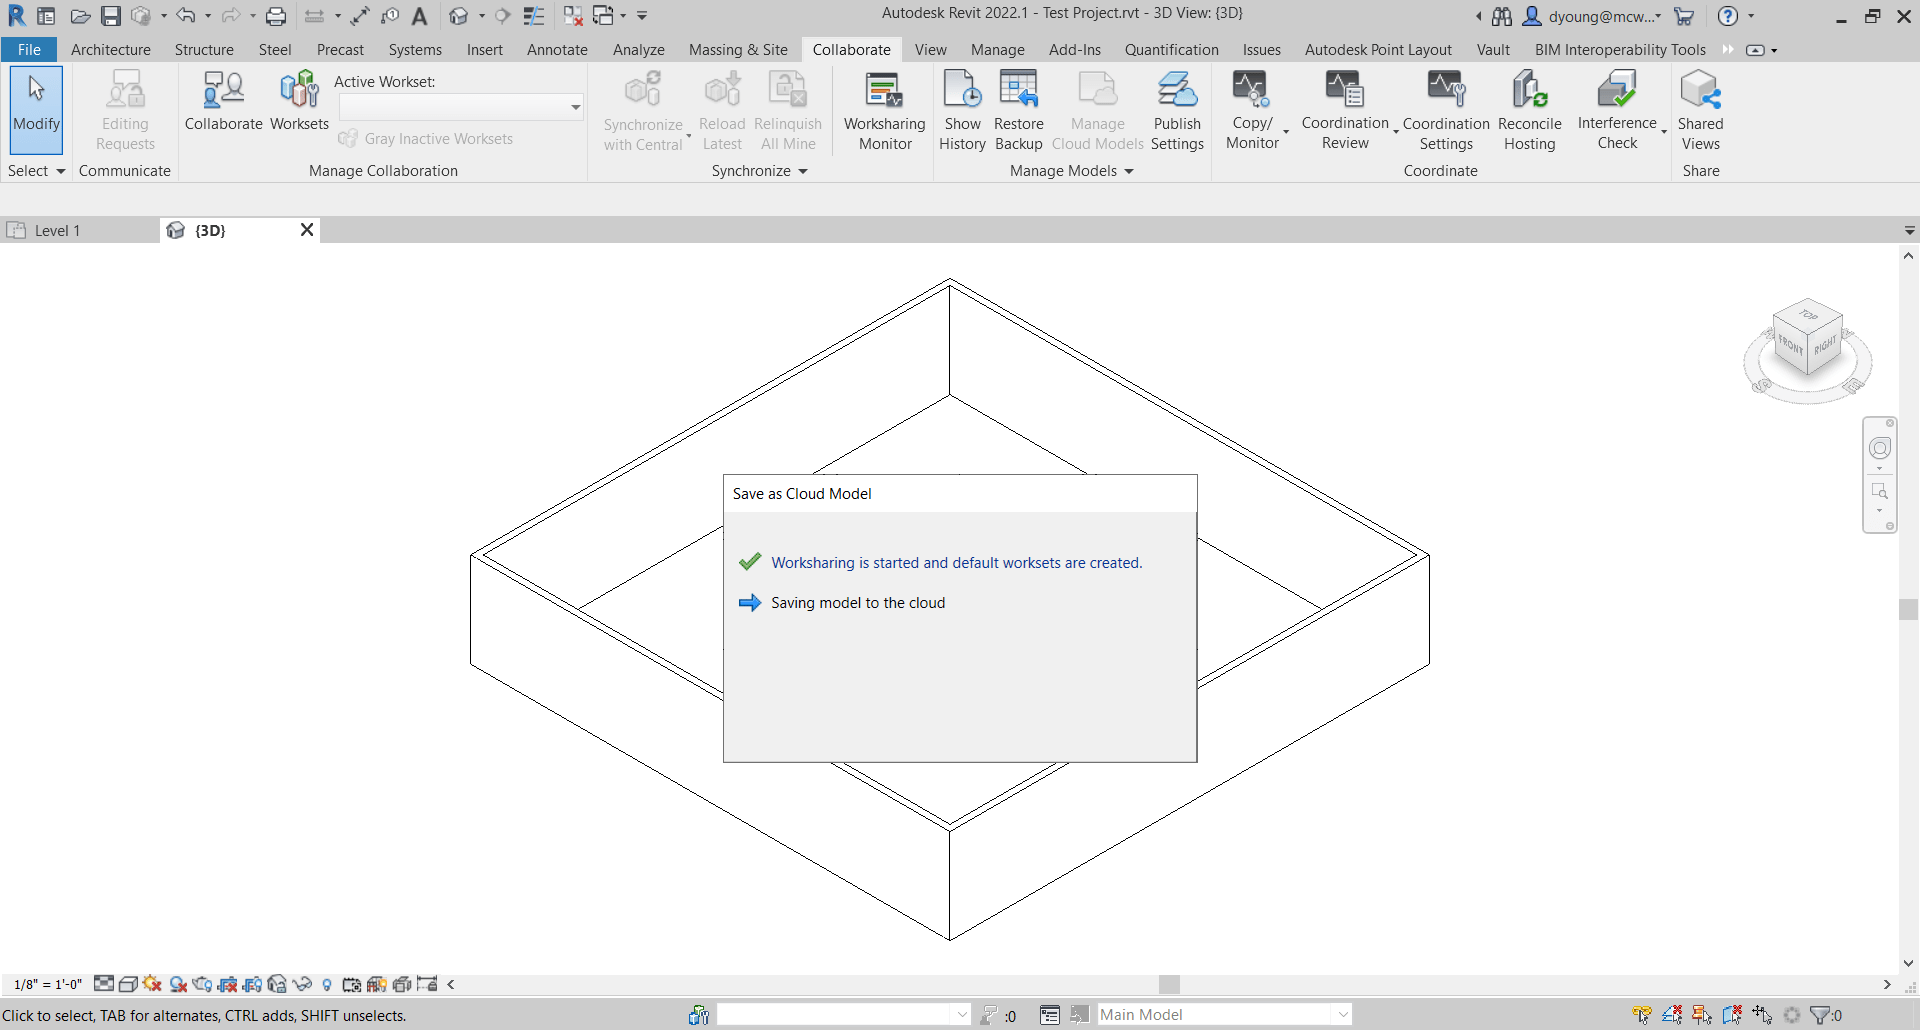
Next, you model something in Revit and Initiate Collaboration…
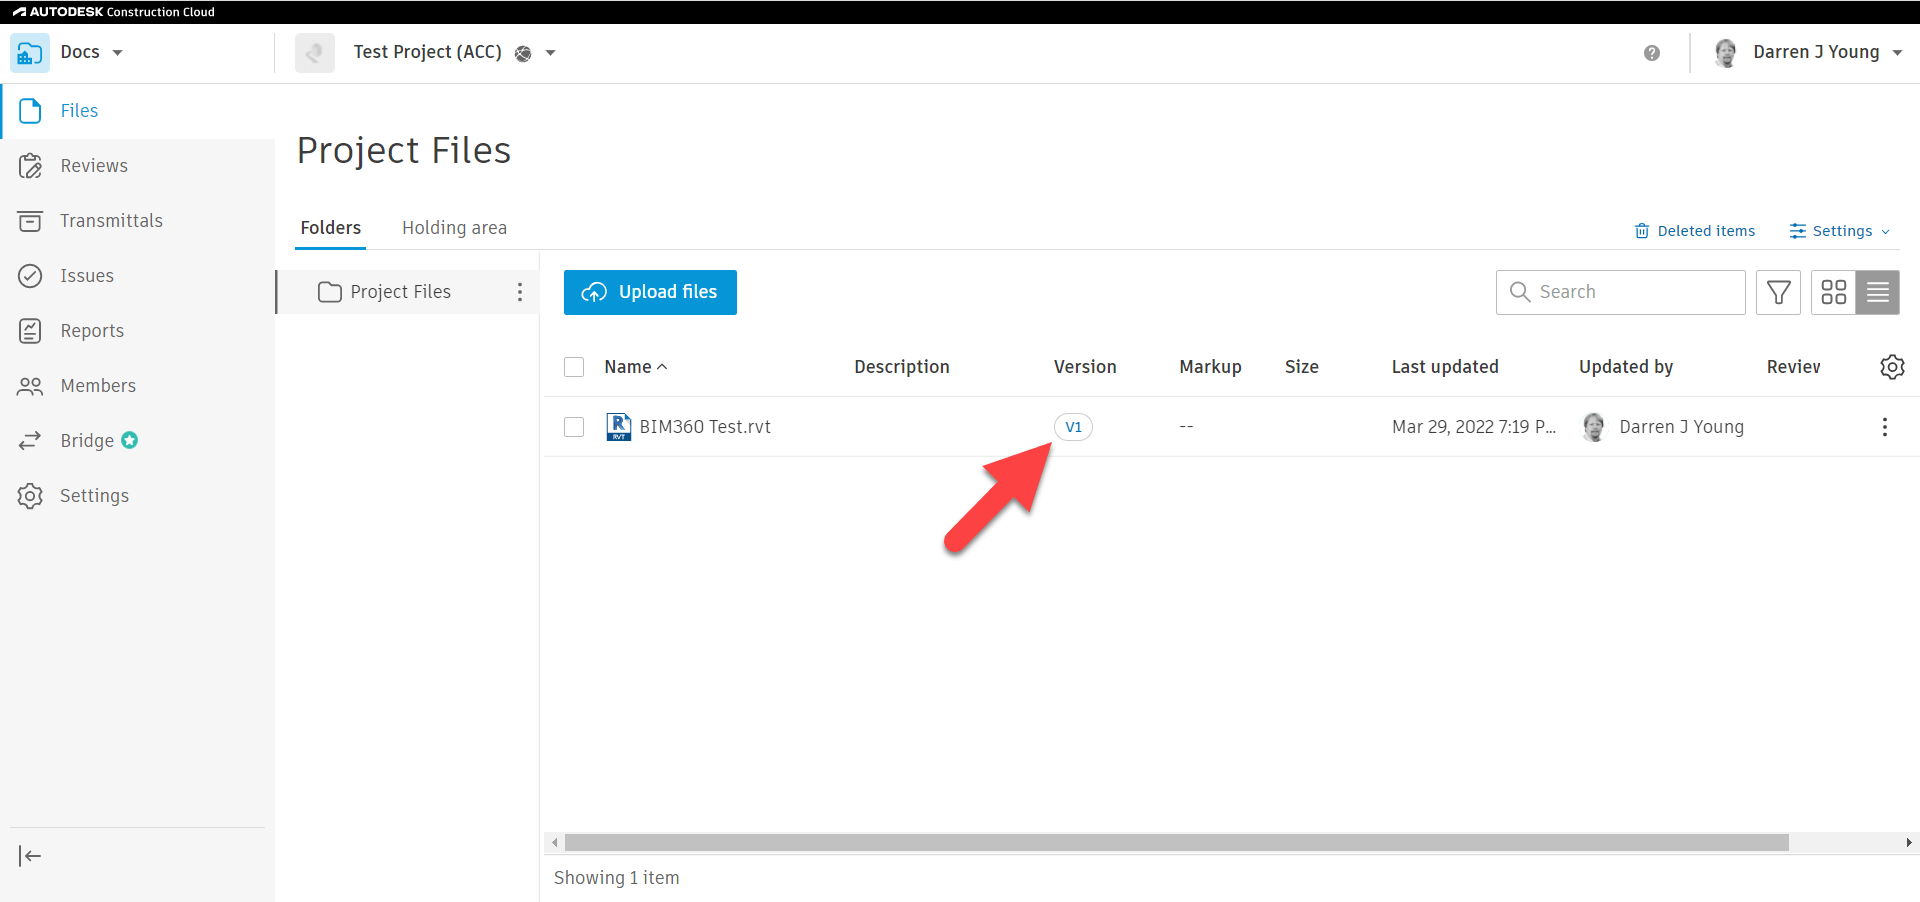
Once Collaboration to the Cloud is Complete, if you look at BIM360 Docs / Autodesk Docs quickly you’ll see the file shows up as Version 1 (v1). At this point, you can’t click on the file to view it. Autodesk’s system is merely creating a placeholder while it continues to process the model in the background.
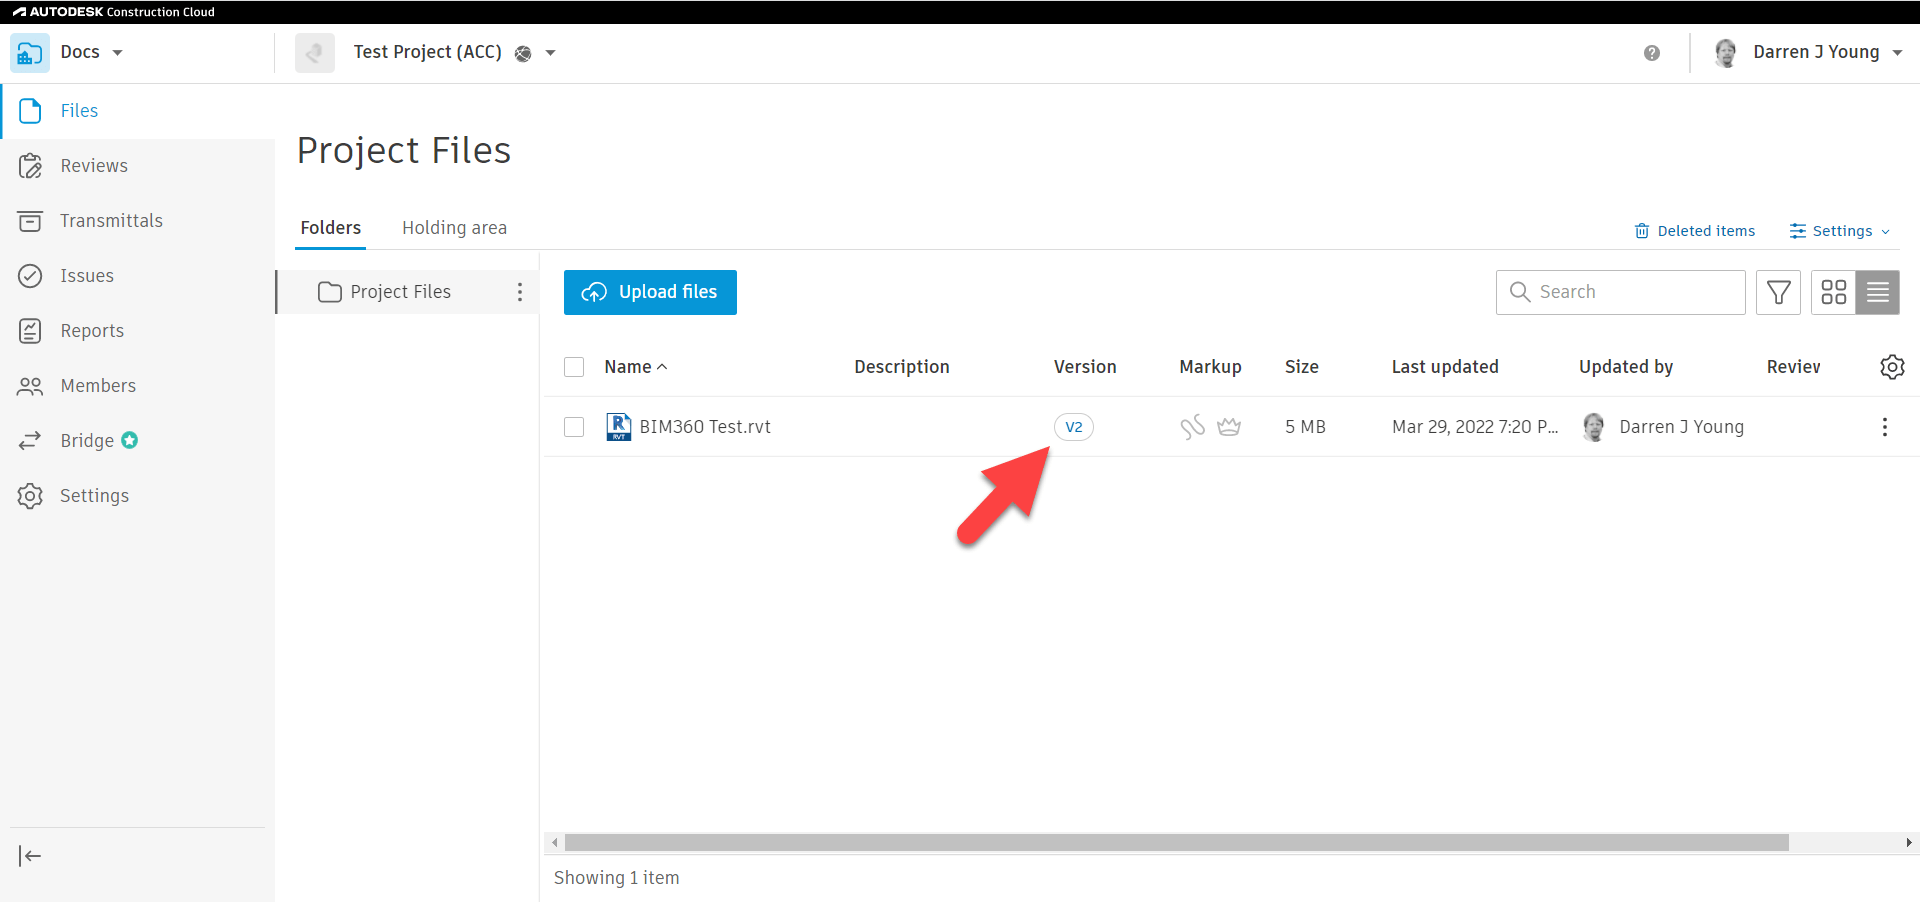
If you wait long enough, you’ll see that the files then update as Version 2 (v2). Once they’re listed as v2, they can be clicked and viewed in the Cloud. Despite saying v2, you really only initiated collaborate once from Revit. v1 was the initial file placeholder and v2 is the finished model that’s processed.
One reason for the confusion is that this v2 model shows up automatically. The common assumption is that it’s the same model as the one you opened in Revit. But that is NOT the case. The v2 model is actually a ‘Processed Copy‘ of the model you had open in Revit. That’s why it took a little while for the v2 model to show up in Docs.
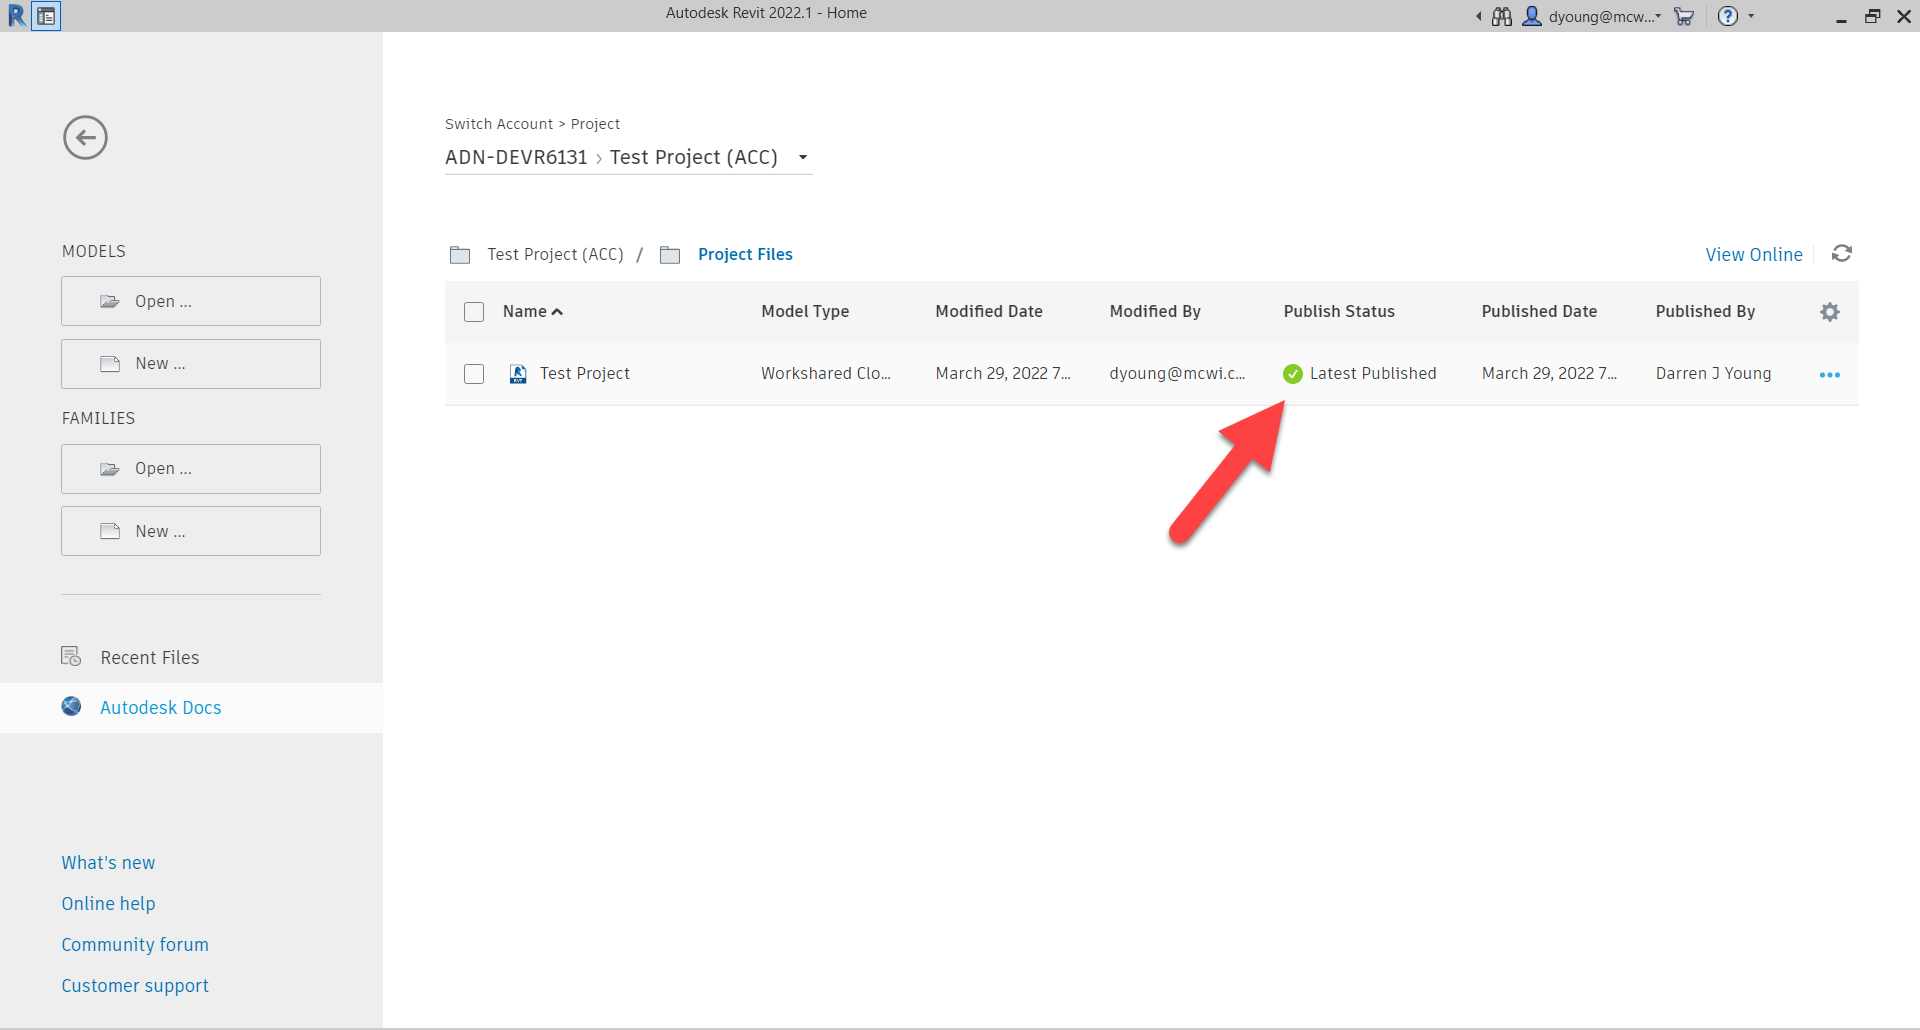
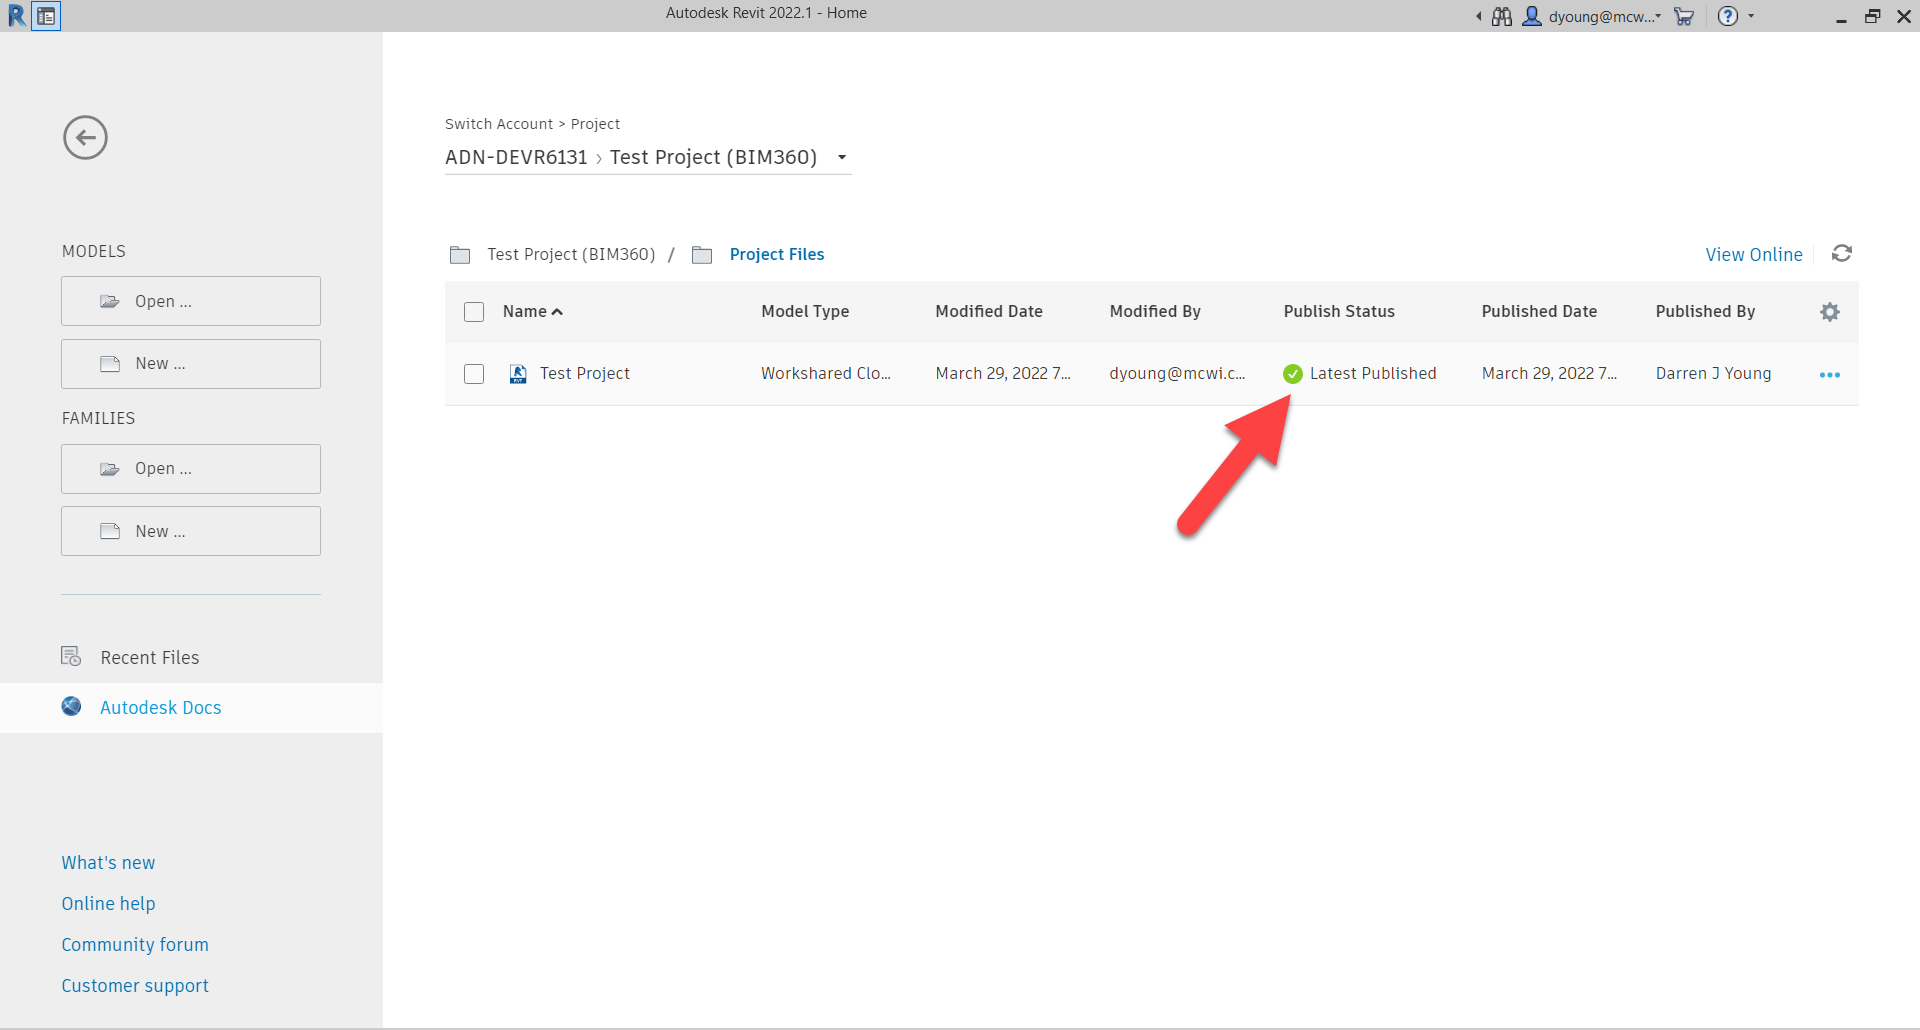
The next time you open the models in Revit, you can see that it shows the models as ‘Latest Published‘. Note that you should be opening the models through BIM360 Design / BIM Collaborate Pro and NOT from the Desktop Connector. More about that later. For now, you can see the models listed when you try to open them in Revit.
If you open these models, they would look exactly the same as those viewed from Docs on the Web. The next thing that happens is people change the model and Sync to Central. This will continue for the entire development of the model. Pretty normal stuff.
Despite syncing changes to the cloud, if you view the models from the web interface of Docs, they’ll still say v2 and show the original published model.
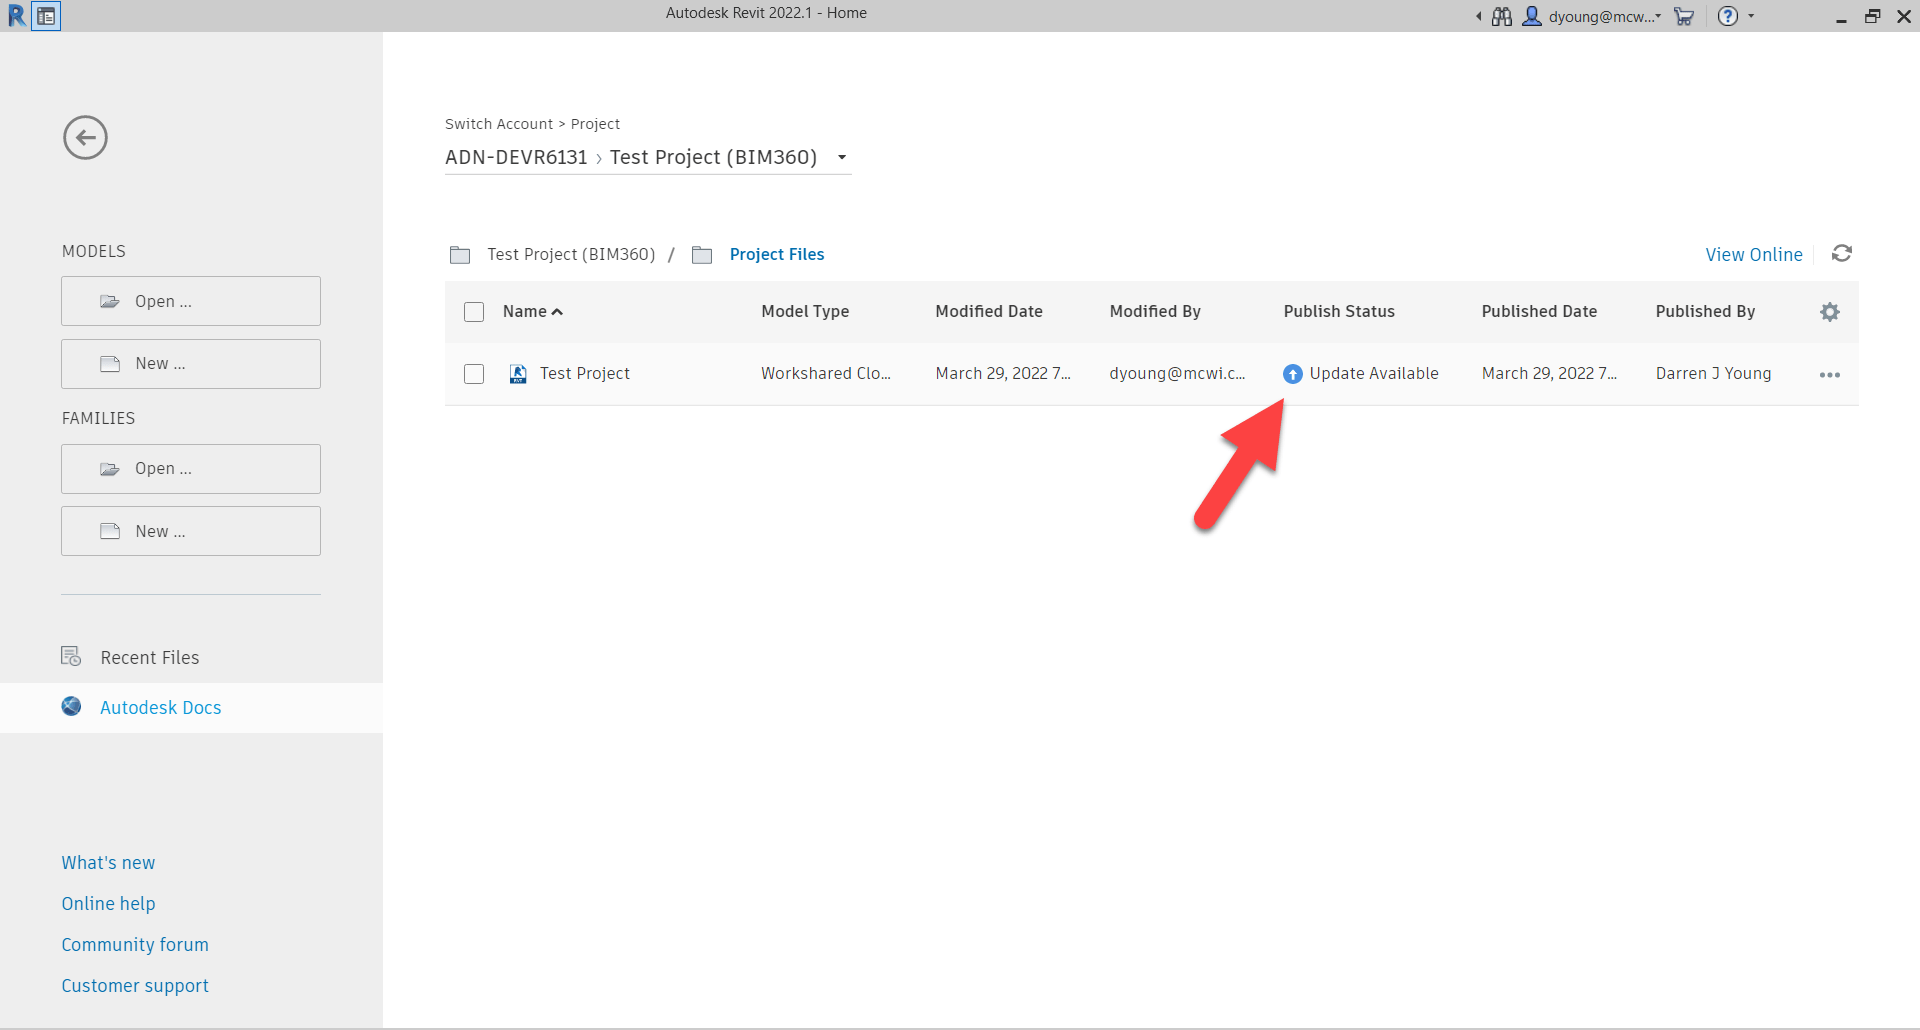
In fact, if you were to close and then try to reopen the model from Revit, you might notice that it now says there’s an ‘Update Available‘. Note: You might need to click the ‘Refresh the current project‘ icon in the upper right to refresh the status. If you haven’t browsed to a different folder/project or restarted Revit the project status cache might be stale and need the refresh.
When an update is available, YOU as the model author can choose when to push those changes to BIM360 Docs / Autodesk Docs. This is why there’s really ‘two sides‘ to models in BIM360. It’s intentionally this way to put you in control. You can control IF and/or WHEN to release your changes to the rest of your team for viewing. After all, you don’t want them to view your partial updates while you’re still working through issues.
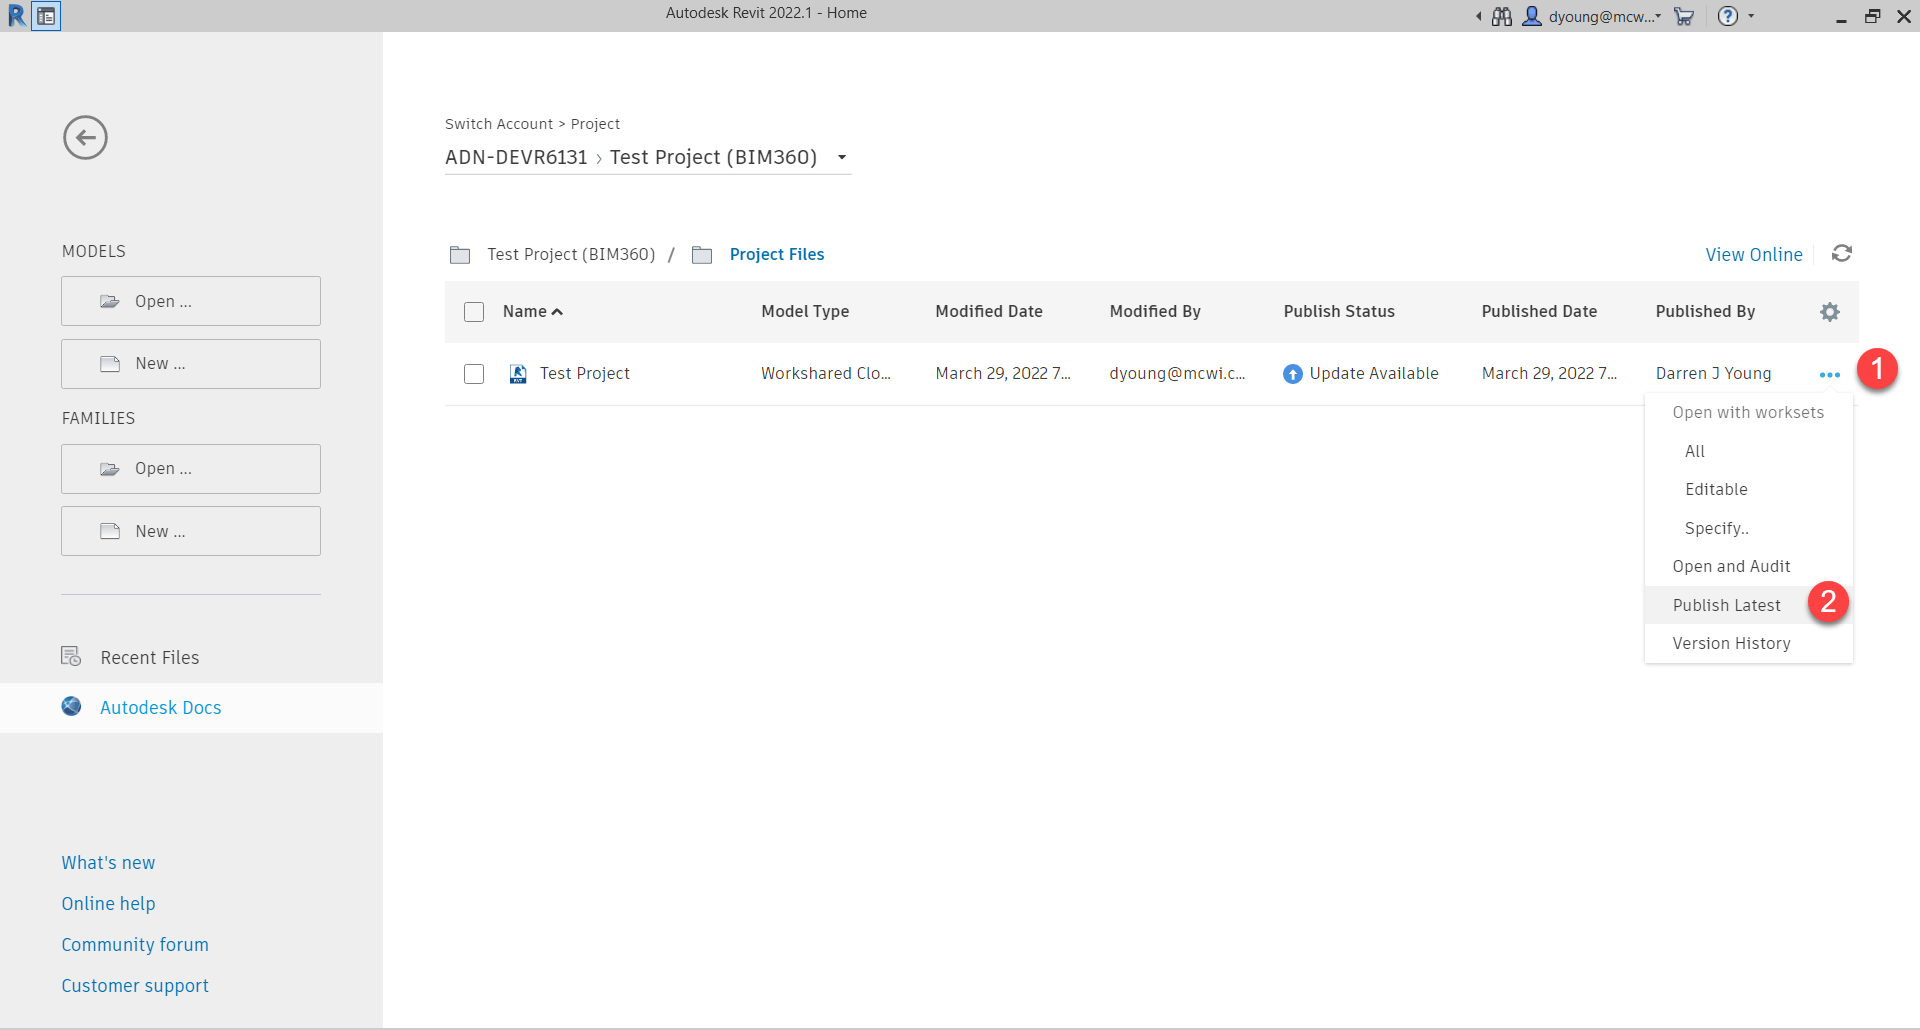
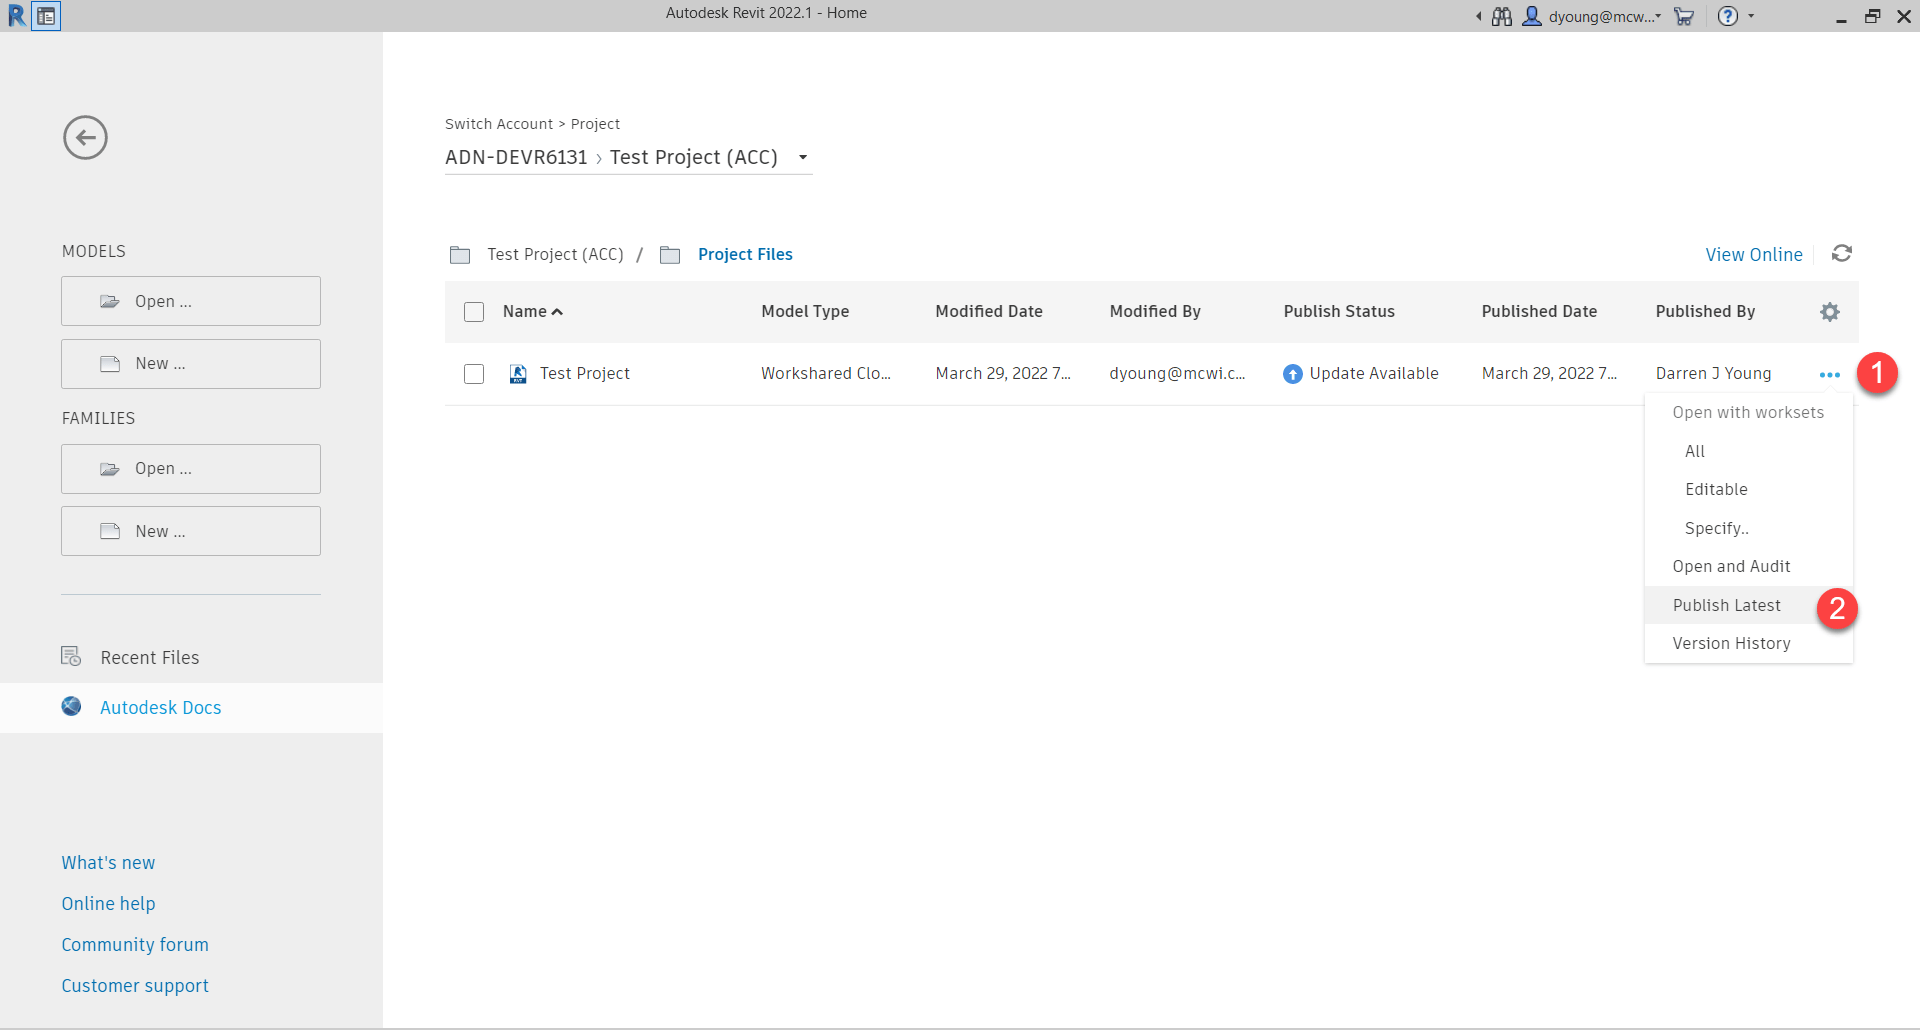
You can choose to update the models right from that same interface. Click the ellipsis button to the right of the file entry and select ‘Publish Latest‘.
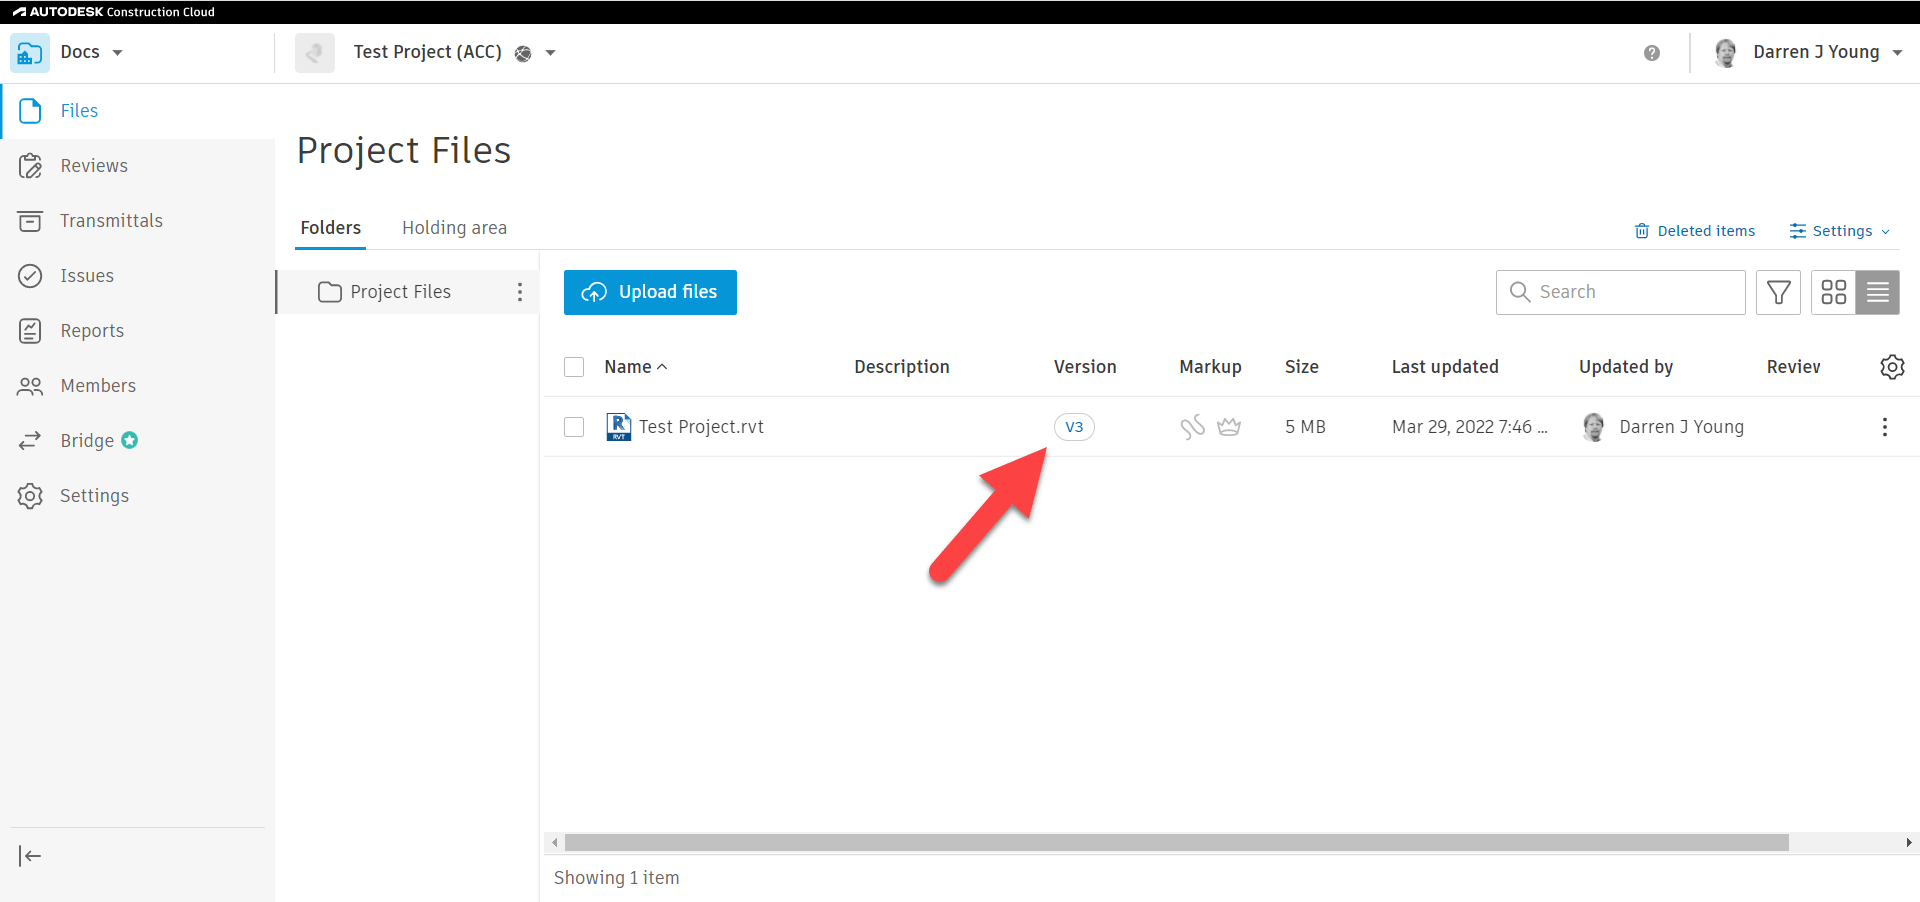
Once you select to publish the latest version, you’ll be prompted for a confirmation with some added details. You’ll then see the interface in Revit show it’s processing. Once it’s finished processing, you’ll be able to open the model again in Revit. If you look back at BIM360 Docs / Autodesk Docs once processing is done, you’ll see the file(s) there are now listed as Version 3 (v3)
At this point, your web view of the model in BIM360 Docs / Autodesk Docs is the same as when you open it in Revit. That is, until you make more changes and Sync to Central again. Once you have new sync’d changes, you’ll have to publish to Docs again. But only when you’re ready for the rest of the team to view the model.
BIM360 / Autodesk Desktop Connector Warning
It should be noted that the Desktop Connector displays what’s in BIM360 Docs / Autodesk Docs. It does NOT give you access to what you’re currently modeling in Revit with BIM360 Design / BIM Collaborate Pro. This may be perfectly well what you want when linking in a model from another team. But if you want their Live updates, you’ll want to Link from BIM360 Design / BIM Collaborate Pro.
Note that Design Collaboration does have advanced features for collaboration. It’s beyond the scope of this post but highly recommended you look into it.
I hope this helps you understand a little better about how BIM360 Docs / Autodesk Docs does and doesn’t relate to BIM360 Design / BIM Collaborate Pro. Just remember, it’s NOT the same model, it’s a published copy. The only time it shows up automatically in BIM360 Docs / Autodesk Docs is when you initiate collaboration for the first time in Revit. All other Sync to Central updates won’t show up in Docs without an intentional Publish by you or another team member.
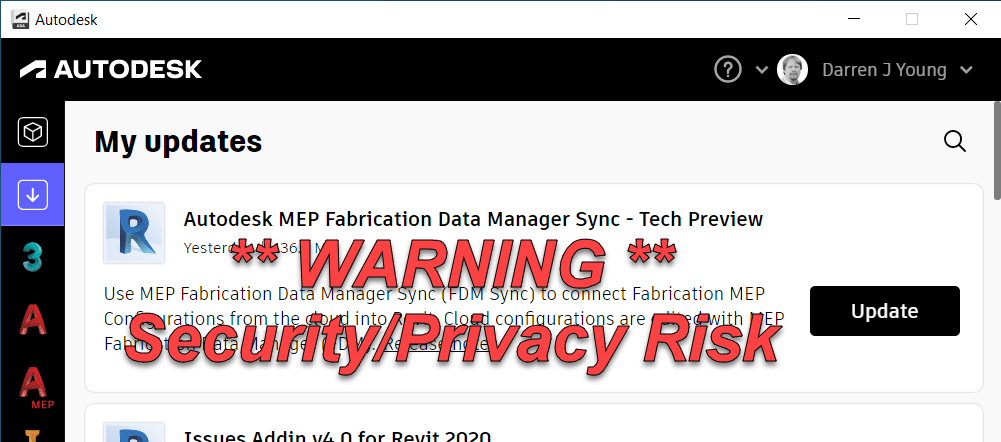
On March 23, 2022, Autodesk released the “MEP Fabrication Data Manager Sync – Technical Preview”. That same day, I posted to several sources a warning regarding a risk in using this tool. In this review, I’ll go over the risks shortcomings as I see them along with what background I can share that’s not covered under NDA. I’ll also address Autodesk’s public response to my warning.
What is the MEP Fabrication Data Manager Sync?
Let’s start with a little background. What is the MEP Fabrication Manager Sync? This is a tool designed to Sync your Autodesk Fabrication configuration from the Cloud to your local system.
But Configuration isn’t in the Cloud you may say. Well, that’s part of the plan too.
Why would we want to do that?
The Autodesk Fabrication configuration is complex and powerful but also fragile and bug ridden beast. Because of this it’s difficult for Autodesk to make changes and fixes. If you recall, in their last big restructuring, they terminated many of the developers who were customer advocates and knew the code. So attempting to advance just about anything it to the ‘Next Level’ risks injecting a LOT of defects into the products we use. If you’re a Fabrication user, you all know what I’m taking about. You’ve lived it.
Enter their ‘Cloud’ strategy to put the Configuration in the Cloud. There, they can put it in a safe environment, refactor it, rewire it and surround it with digital bubble wrap to product it’s integrity.
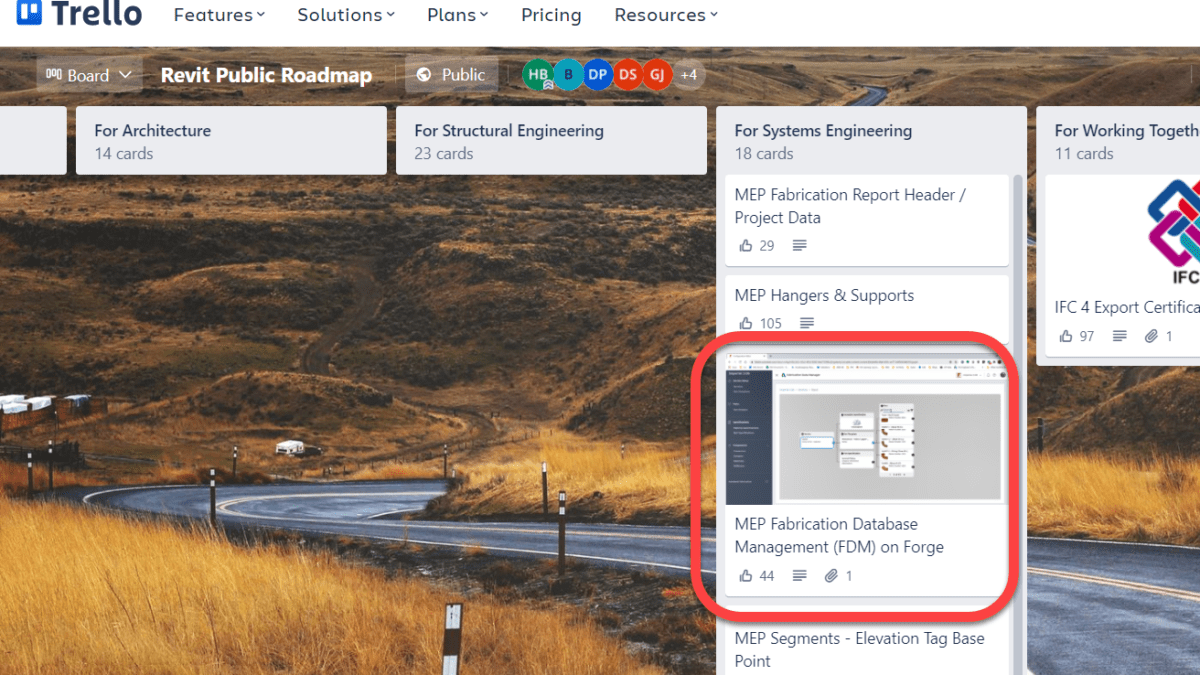
This has actually been on the “Public Revit Roadmap” for a long time. I believe it even predates the existence of the public roadmap.
This strategy is one reason why Revit Fabrication parts had had little added development other than token improvements since about 2018. Lets face it, if they were to build it from scratch today, they’d do it differently then it was 20 plus years ago when CADmep came out. Makes complete sense what they want to do.
But as anyone with even the slightest electrical charge in their skull knows, you can’t put the configuration in the Cloud and have a Desktop product access it and hope to have any shred of performance. Hence, the “sync” tool to pull it back down.
So to summarize, Autodesk’s Cloud strategy for Fabrication is to push it to the Cloud where it can be protected and enhanced but not used. And then they’ve built a tool to sync it back down locally for use in Revit only….for piping only….only for your company…only if you never need a new fitting…only if you don’t use ESTmep, CADmep or CAMduct.
What’s Wrong with FDM?
There’s a long list of things wrong with what was released. Here’s a high-level overview.
Major Issues and Limitations are NOT disclosed.
FDM is NOT Disclosed as “Beta” or “Not for Production”
Estimating/Labor data easily distributed to others with no ability to recall it.
Only a single “owner” of a configuration with no way to change the owner.
Anyone can easily upload your Configuration and use or share it with anyone.
No new Parts, Seams, Dampers, Stiffeners, Supports, Ancillaries, etc.
Once uploaded, no way to “Re-Upload”
No interoperability to CADmep, CAMduct or ESTmep
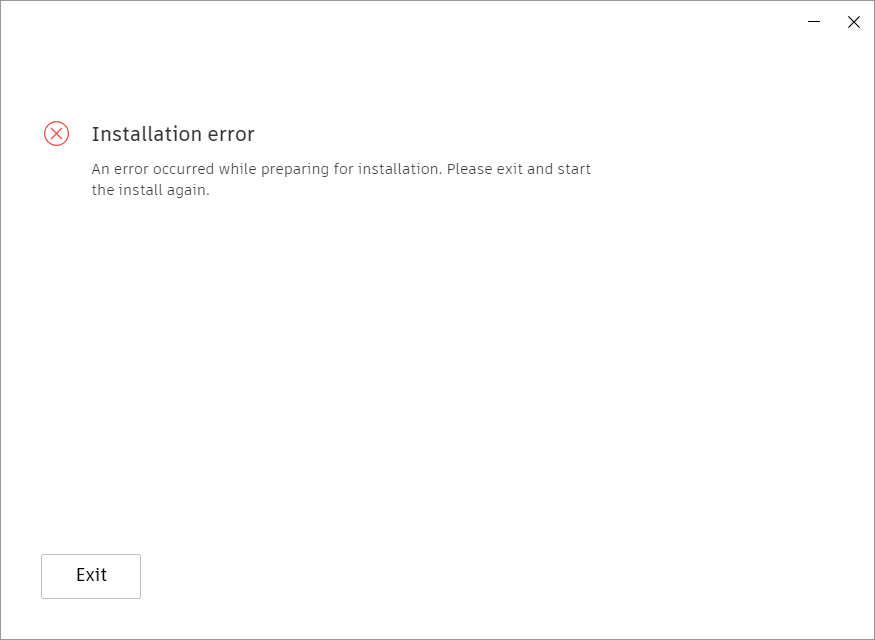
Install Errors
Limitation & Issues Disclosure
There’s a lot of limitations with FDM and the Sync tool. Do NOT make the assumption that their list of limitations and issues in the help file are in any way near complete or comprehensive. There’s so little covered that it makes it appear the problems are trivial. They are not. It’s embarrassing how little effort they put into documenting this. You really need to read everything and infer a lot based on what’s said and not said. This is the only way to get a full picture and use this product with minimal risk.
Is FDM a Beta or Complete Product?
You may have seen Autodesk product manager Martin Schmit’s response to my post that FDM and the Sync tool are Beta and shouldn’t be used in production. You can see them here…
The description in the Autodesk Desktop App does NOT say or mention ‘Beta’. So no, it’s not listed as a Beta here. Other Technical Previews in other products didn’t provide ‘Beta’ notices either of the ones I saw.
During install or once installed, review the ‘Terms of Service’ in the Sync Tool. It contains 2,709 characters / 501 words and not a single instance of the term ‘Beta’. Not listed as a beta here either.
The initial help file/Release Notes contained 14,290 characters / 2,698 words and again, not a single instance of the term ‘Beta’ in the initial release. In fact, under ‘What is a Technical Preview’ it stated the following…
“Tech Preview applications are considered complete and ready for use, but are made available on a preview basis so you can get early access before a broader rollout to all customers.”
It’s since been updated (likely because I called it out) to read…
“Tech Previews provide early access to pre-release or beta features for evaluation.”
But while it now contains a single ‘Beta’ term, it simply states that generically. A “Technical Preview” contains “pre-release” OR ‘Beta’ features. Nowhere in there does it state that this FDM is indeed a ‘Beta’.
The Blog Post also mentions that “Pre-release OR Beta” is what a ‘Technical Preview’ is and does NOT actually state that this is indeed beta. Merely that a Technical Preview may contain some Beta features. That’s a far cry from the entirety of the product being considered Beta.
There’s a link in the terms of service to Autodesk’s general ‘Terms of Service‘. That page contains 67,123 characters / 12,3871 words and contains the term ‘Beta’ merely once. Here in section 12 ‘Trial Versions’ the term ‘Beta’ is listed along “Not for Resale’, ‘Free’, ‘Evaluation’, ‘Trial’ and ‘Pre-Release’ terms. It’s a generic document that does not refer specifically to this Technical Preview. And it merely says that ‘Beta’ is one of many ‘Trial Versions’ that are governed under the ‘Trial Versions’ legal limitations. So yet again, it’s NOT listed as a beta here.
One of the YouTube videos linked the blog post mention using the Sync tool to distribute your database ‘Across Stakeholders’. This is not something you’d suggest for ‘Beta’ software or things you shouldn’t use in production. It implies collaboration…across stakeholders.
Am I being a bit picky? Perhaps. But the fact is that after 6-7 years of work on this, it’s still sloppy and incomplete. And unless you fully read everything and make a lot of conclusions based on interpretation and reading between the lines, the average user has no idea the risks they’re taking.
Where’s the Risk?
The risk is Autodesk’s repeated gross negligence in providing tools that expose your price and labor data. This is the 3rd avenue Autodesk has given users tools that provide easy access to your price and labor data. The other 2 avenues for this occurring still exist today with no acknowledgement from Autodesk.
Giving you a tool and telling you its to help you easily collaborate with users without generic sync tools implies you can collaborate with it. But if you add collaborators, you aren’t told that they have access to your cost and labor data. If you saw Autodesk’s public response to my initial post, you can see them hide behind the rather weak “you’re in complete control of sharing” statement.
I suppose you can give a powerful and dangerous tools to any unsuspecting person and them blame them for the carnage they create. But it would seem to me, any firm that is intent on being your partner would have a responsibility to disclose risks associated with the tools they provide.
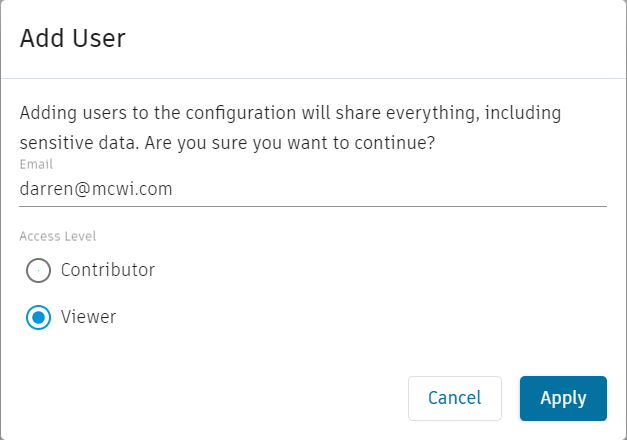
Here’s the only warning Autodesk provides…
A mere generic warning upon sharing is NOT enough. There’s no link to details or context. From a user’s perspective a generic message like that could merely be a blanket ‘CYA’ legal statement as virtually anything a user shares could be considered ‘Sensitive’. Further, take into account that the Web based FDM shows no Cost or Labor data, it doesn’t let you add or manipulate it. This would easily suggest to a user that Cost and Labor are NOT included. Especially considering their own documentation says Cost and Labor are ‘Future’ considerations.
FDM Configurations are downloaded to this location…
%userprofile%\AppData\Local\Autodesk\Fabrication
Browse within these folders and into the Databasefolder and you’ll see COST.MAP, FTIMES.MAP, ETIMES.MAP and SUPPLIER.MAP. Once shared with another user, the Configurations owner can NOT pull them back. All it takes is copying this database to a new location and add it to ESTmep and you’re Price and Labor data is hacked.
This is a Known Issue yet it’s not disclosed in the ‘Known Issues’.
Only One Owner
A Configuration can only have one owner. It also has no way to be changed without Autodesk’s back end assistance….maybe. Again, a limitation you’re not told of. If whoever manages your configuration leaves and you’re up a creek.
Any because Autodesk accounts are tied to Emails, they have full access to your configuration even after they’re gone. It’s yet another security risk for which YOU are not able to manage or control.
Easy End User Manipulation
Again, there’s no control you’re allowed for users. If you install this tool to your user’s system so they can consume a configuration you shared, they can upload and share it with anyone they want. Super easy and you’ll never know. Yes, they could always give your database to someone anyway, but it’s a very intentional act and requires some technical knowledge. This sync tool merely looks like an easy way to collaborate with little warning about what the consequences really are.
Database Coverage Limited
There’s not a lot you can so with FDM at this point. You can make new services, templates, materials and specifications. But you can’t copy an ITM or make a new one. You can’t edit the product list of an ITM. Can’t make Ancillaries, Kits, Dampers, Supports, Stiffeners, Notches. Support Specs, Service Types, etc. You can’t edit Labor or Price. You can’t edit service types, custom data, oval stretch outs, etc. So there’s not a hell of a lot you can do. You can’t really manage your database. Additionally, there’s no capability to bulk edit even those things you can edit in FDM. It’s certainly not going to be faster to edit your database. At best, trivial edits are allowed. Any other use is going to be burdensome.
No Way to ReUpload
Once you upload a configuration, you can make some limited changes there. But not everything. Everything else you need to edit in CADmep, ESTmep or CAMduct. And once you do, there’s no way to upload your changes. Your only option is to delete the Configuration on FDM and loose any changes you made there.
So now you have 2 independent vectors for editing your database. One partial (FDM) and one complete like you always have. And there’s no way to reconcile those.
Now Autodesk will tell you they’ll be adding more. But judging from how they’ve implemented Fabrication Parts in Revit, they’ll never finish it according to YOUR expectations. They’ll get it to where they’re happy and call it good.
No Fabrication Interoperability
There’s NO interoperability with CADmep, ESTmep or CAMduct. And there’s no plans to near as I can tell. Read what they’ve pushed out. Their sole focus is on Revit. If they get to Cost and Labor it’ll be under the assumption that Estimators will use Revit to quantify their estimates. I can’t imagine a world where a mechanical estimator will use Revit to take off estimates. Another stupid half baked idea.
To add insult to injury, Revit does not report ‘Node to Node Length’ in Reports…it doesn’t work. So Autodesk’s official solution is to export an MAJ and run your reports from there as outlined in this KB Article. So for products they don’t want to support, they seem to be the solution to everything wrong with Revit as well as FDM.
Install Errors
I’ve had far more systems produce install errors than those that actually install properly. They knew of the error I reported it before release.
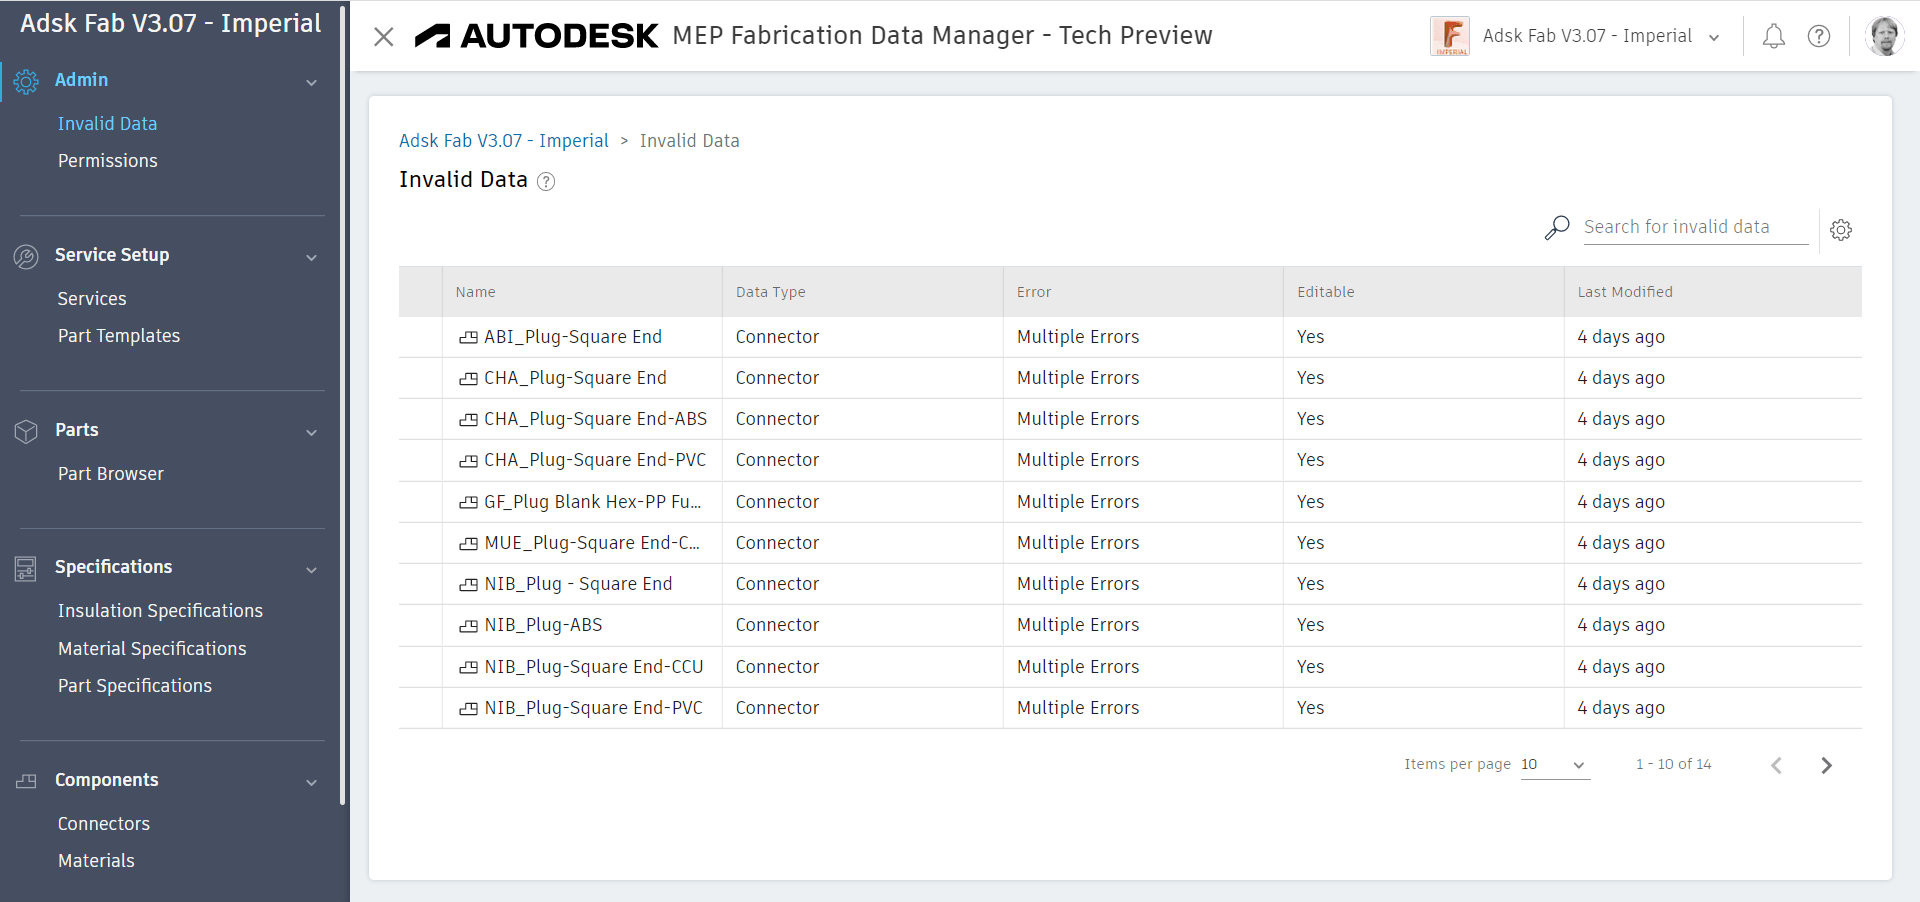
Well, a couple things. For starters, when you upload a configuration you can see the errors it contains. Ironically, they’re things that are perfectly allowed in Fabrication, just not FDM. You can use the Invalid Data portion to review the data errors. Autodesk’s own Configurations (all of them) are not even compliant as shown here…
One of the other good things about FDM is the ability to more easy visualize how your data is connected. Using their Relationship Manager you can see how your data is connected. This is good for new users as well as existing users who want to see things like which parts are connected to a material or connector or service template.
What else? Well, I can’t really think of anything. FDM is just not ready. And until you can edit your entire database in FDM, it can’t really be used. But that falls on deaf ears. They want input on what to “do next”. But that won’t increase usage. And if this takes another half decade, it’ll likely never get completed. That’s a LOT time in Autodesk years to have a project survive and get funding if it’s not used.
Summary
The Fabrication Database in the cloud has been done before. It was there and much more complete. I saw it. It was previewed at Autodesk University years ago. But it never saw the light of day. They killed it. It wasn’t built on Forge. So they did it again and built it on Forge. But Forge wasn’t ready or capable. So it took 6-7 years to get where we are today. Half assed and incomplete. A year into the project they said it would take another year. I told them it would be at least 5. I was wrong. It took longer. And it’s still not usable. It’s poorly documentation and so disjointed in their messaging that it risks your data.
They have no strategy or end game for how to work in EST or CAM. Now they want your input into what to do next. Except it’s obvious if they listened to everyone they ignored for the last 5 years. Their exclusively Revit based strategy has no promise for you any time soon. Worse yet, it lacks vision and doesn’t even strategically align with where Autodesk is going. That’s not just my opinion, it’s that of several insiders I’ve spoken with too. Their strategy is based on a 20 year old software called Revit.
So kick the tires if you like. But don’t install this garbage for anyone else. And for the love of God, don’t share your configuration with anyone else.
Lastly, if you want to know what you should or should not do with it, you can’t rely on the documentation. Apparently Autodesk’s official guidance and policy is buried in a single blog post per their response to me.
Autodesk Flex is Autodesk’s replacement for Network Licensing (FlexLM). Network licenses were supposed to go away a couple years ago. However Autodesk pushed back a lot of their plans and policies to make life a little bit easer when Covid hit.
While many customers had already been arm twisted into changing prior to the timeline extension, that offer still exists today. If you haven’t taken advantage of it, you will need to before it expires on your next renewal before Feb 7, 2024.
What is ‘Autodesk Flex’
Autodesk Flex is a ‘Token’ based system. Each product has a certain number of ‘Tokens’ it costs when you use them. Launching a product consumes that set amount of tokens and gives you access for the day to that product for that user on any computer. If you launch multiple products, each product will consume it’s daily tokens upon launch for that user.
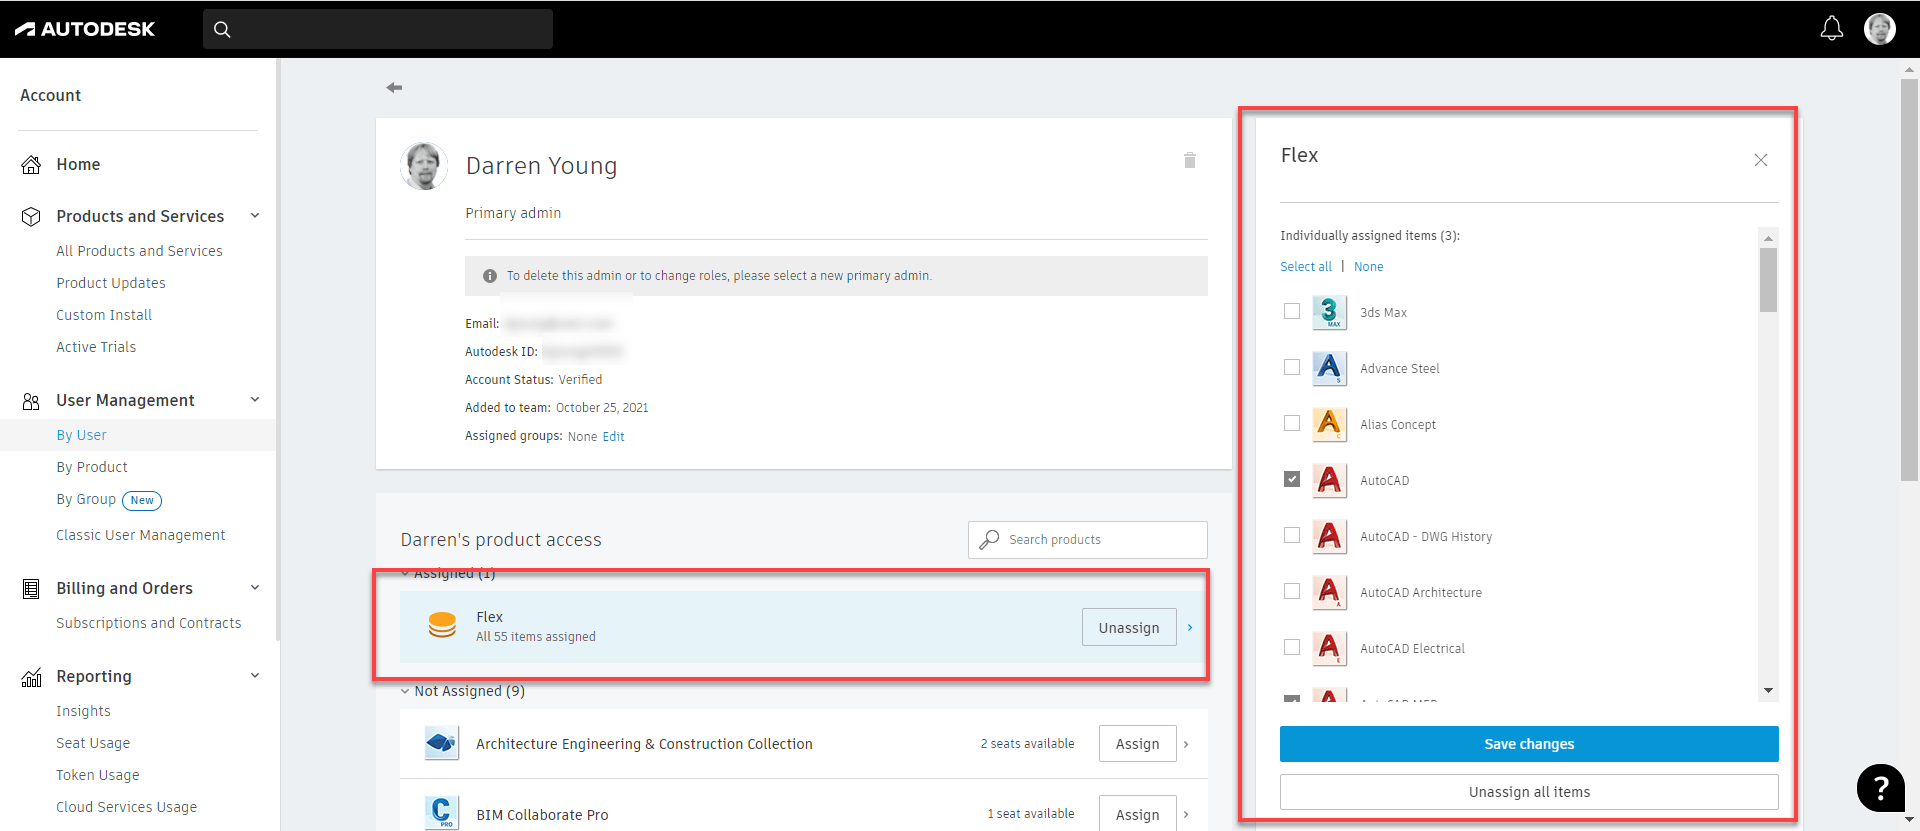
You assign ‘Flex’ to a user in the accounts portal just like any other product and it lets you run anything Flex has available.
You can also pick and choose which products you want to allow Flex to use if it’s helpful to not allow everything. An example would be that maybe a user needs Revit all the time, but Navis Manage only some of the time. You can give them a dedicated license of Revit and configure Flex to only be used for Navis.
(Note: This example is only if you have separate Navis and Revit licenses. AEC Collections come with both so this configuration isn’t valid in that scenario.)
Tokens are pre-purchased in set increments. They’re currently $3/token. Tokens will expire if unused for a year. You can add to your pool of tokens any time. Oldest tokens are automatically consumed first.
Autodesk has a token calculator that helps you estimate the number of tokens you need for a given product. That calculator is here…
You’ll see the cost difference between Flex and a dedicated Named Standalone license is about 85 days. If a user uses a product about 85 days a year, a Standalone Named User license is a better option.
When you get to Collections…it gets a little more difficult. Collections don’t have a Token rate so you’ll need to add the tokens for the products you use. The examples above are assuming you’re 2 products a day. You’ll see the cost benefit of Flex drops to 60 days. But it’s also more complicated…if you run three products one day and only one product another, the formula gets pretty complex. You’ll need to estimate how many times a user will use each product in the collection a year and add up the costs.
When Does ‘Flex’ Make Sense?
So what does this mean? Flex is really a benefit for users who use one or two products infrequently. The more days a product gets used and/or the more products that get used by a user, it might be better to consider a Named User license to a Collection.
On the other hand, if someone uses a product every day but only for a few minutes, Flex just doesn’t work. Tokens are consumed on a Daily basis regardless if you use it for 5 minutes or 15 hours in a day. In that way, Flex does not come even close to the old FlexLM network licenses.
Do your math carefully. Estimate conservatively. You can easily spend MORE on Flex than you would a Named User Subscription. As an example if you used AutoCAD 5x a week for 50 weeks a year, it’ll cost you $5,250 annually compared to $1,775 for the subscription.
It’s Not All Roses
There’s several issues with Flex that are not well known or discussed. You really need to understand how Flex works to keep from getting bit. Here’s some of the major areas of concern that you should be aware…
Not All Products Available – Flex allows you to run most products but not all. Some of the products that are commonly used infrequently like Fabrication ESTmep and Autodesk Point Layout are not part of Flex. I routinely hear Autodesk and resellers say you can “run anything you want” but that’s simply not true.
Cloud Products Not Included – This doesn’t seem like a big deal but consider the case of Revit. You can run Revit on Flex for someone who needs occasional access. But if your data is on BIM360 or Autodesk Construction Cloud, you’ll still need a full desiccated license of BIM Collaborate Pro.
No License Timeout – The old FlexLM Licenses could be configured to automatically check in their license if the product sat idle for too long. Flex does NOT work this way. If you have users that leave their products open when the leave, you’re racking up Token utilization over the weekend or while they’re on vacation. You’ll definitely need to train your users to CLOSE unused products at the end of the day.
Reporting – You can get Token reporting for Flex licensing. But user level reporting that isn’t in aggregate or data usage exports of daily details, you’ll need to have a Premium subscription.
Summary
Autodesk Flex is a great option for people who use a product occasionally.
Autodesk Flex is NOT a good option for people use use products frequently but for short durations.
You can easily exceed the cost of a dedicated license with Flex is you’re not careful.
Proceed slowly with Flex. Start small. Watch usage frequently.
One of the things that can make machine setup difficult in CAMduct is setting up the coordinate system. This coordinate system must reflect the actual configuration of the machine. Some machines can be reconfigured to swap the axes or set the origin to any corner. This lets you configure the machine to match the software. Others can’t be reconfigured and require you to configure the software to the machine.
It doesn’t really matter where the origin is on the machine, just as long as the configuration in CAMduct matches. Matching the machine isn’t difficult, just as long as you understand what’s happening.
Default Origin and Axis Orientation
In the Machine Setup Dialog, the default Origin is in the lower left. Take a look at the settings and note the X-Axis and Y-Axis directions.
From this configuration, here’s a simulation of the code that’s generated.
If this configuration doesn’t work for your machine, it typically means the machine has a different origin and/or Axis configuration.
This next configuration rotates the coordinates which results of the X-Axis and Y-Axis being swapped. It also looks like the Origin location changes given the picture, but that’s not the case. This is why Machine Setup can be confusing. This picture does NOT change the origin location. This will become clear shortly.
With this configuration, you’ve now rotated the Coordinate System. When you look at the Simulation below, you’ll that the origin doesn’t actually move. The sheet is still oriented the same way. Long direction is the Rail and the Short direction is the Beam.
What you’ll notice here when looking at the code, is that the Part is Still oriented in the Lower Left Corner of the sheet. However, the X-Axis and Y-Axis are swapped. Additionally, looking at the code on the right, you’ll see how the Y-Axis goes into Negative coordinates. This also isn’t what most machines want, they typically work in positive coordinates but this is easily fixed which we’ll show a little later.
This next configuration sets the X-Axis and Y-Axis so that both are mirrored…or rotated 180 degrees.
Looking at the simulation of this configuration, you’ll see both X & Y Axes are using negative coordinates.
Here the both Axes are in negative coordinates and the Part is still located in the lower left of the sheet. Again, not what a machine wants typically, but easily fixed and covered in a little bit.
Here’s the last configuration. Again notice which way the Axes are oriented.
In this next configuration, the X-Axis and Y-Axis are reversed like before. But this time, the X-Axis is in negative coordinates where as the Y-Axis is in positive coordinates.
Fixing Negative Coordinates
What makes this hard, is that the setting in the dialog makes you think you’re moving the origin of the code. You are not. You’re merely rotating the coordinate system. This is critical when using a machine tool like a Lockformer or Vulcan that uses Trimble’s TookShop controller (formerly called Vulcan). Those are a couple of the most common machines where the X & Y Axis are reversed.
When you look at the simulations, the sheet is still oriented in the same location and the part starts in the same location on the sheet.
You can look at the configuration and see that the Rail is set to the long direction and the Beam is set to the Short setting. Remember this….it’ll be important in just a bit.
For this example, we’ll again use the 90 Degree rotated configuration (our second example) where the X & Y are reversed and the Y-Axis coordinates are negative. You can see in the code, that the Y-Axis is the LONG sheet dimension due to the rip cut along the Rail that’s cut at the end of the program.
Because the Rail Rip Cut starts at Y=0.0 and goes to Y-120.0, you can see that the Origin is still on the left side of the sheet not the right as the configuration screen suggests. Here’s a reminder of the Axis directions…
So if cutting the Rip Cut on the sheet from Left to Right for 120 units means the coordinates go negative, it’s clear the Origin is on the left. To make those coordinates go positive, you need to shift the Origin to the right on the Beam (Y-Axis). You can do this on the Controller tab and entering the shift amount for the Rail.
How, when you run a simulation on this setup, you’ll see the Y-Axis is still the long sheet direction, but they’re all positive coordinates.
Notice on the simulation that the part is STILL on the left side of the sheet and because we shifted the Origin to the right side the Rip cut along the Rail (long side) goes from Y=120.0 to Y=0.0.
You’ve now successfully swapped the X&Y Axis and corrected the coordinates to they’re all in positive units. From here, you can go back and finish configuring all your other preferences like where the parts get nested on the sheet, starting cut location, etc.
Quick little Stratus tip. This on for headers on your Dashboards. A normal dashboard doesn’t have the ability to customize the header. However, being Stratus is a web based application, you can inject some simple HTML tags to perform some limited modifications.
Take a look at the following headers….
These headers are a result of inserting some very simple HTML tags. Here’s a look at the Report configuration for these header modifications…
Here’s an explanation of these HTML Tags…
HTML Tag(s)
Description
Usage
<br>
Break Line / Carriage Return
Place between text to create a new line
<i> </i>
Italics
Text placed between these tags will be italic
<u> </u>
Underline
Text placed between these tags will be underlined
A few things to note…
You can nest <i>Italics</i> and <u>underline</u> to transform text to <i><u>both</u></i>.
More complex HTML tags don’t work, there’s just too many special characters.
HTML tags may (will) show in other places like in the output of CSV files and/or other types of reports.
The usage of HTML tags in your Dashboard headers is likely not supported. If you find any errors within Stratus on pages that you’ve used these, you may want to remove them to verify the special characters aren’t the cause of your issues.