Digital Transformation for the Average Contractor (Part 1)
There’s a lot of buzzwords in the construction space. Digital Transformation…Industrialized Construction…Machine Learning….Generative Design…Augmented Reality…Drones…Robotics….and the list goes on. So what do you do? Today? Tomorrow? Next year? What actions do you take to prepare for a an unknown future? All while managing the challenges of your current projects, staff, backlog and cashflow.
I use the mechanical engineering/contracting industry in my examples. However the essence of what I’m about to say is applicable to almost any contractor. If you don’t have an unlimited budget, time and/or resources, knowing how to prepare for an uncertain future in the heat of battle can be alarming.
But it doesn’t have to be. You don’t need a crystal ball. You don’t need unlimited overhead and staff to properly prepare yourself and prevent yourself from becoming obsolete from business disruptors. What you need is a good plan. A plan that helps you understand what’s happening, why it’s happening and most importantly how to make the correct turns when you’re not sure exactly where you need to navigate.
The problem…
The contracting business is changing. This is creating a few big challenges to maintaining profitability and efficiency. To survive, we need to tackle these changes head on. Don’t worry, it’s not that hard.
What’s Driving This?
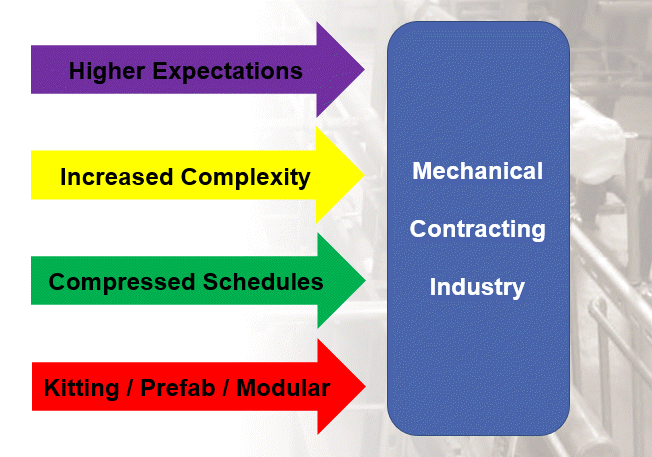
A lot of things are driving these changes, most of which can be grouped into one of two categories. The following lists outline some of the major trends and shifts occurring.
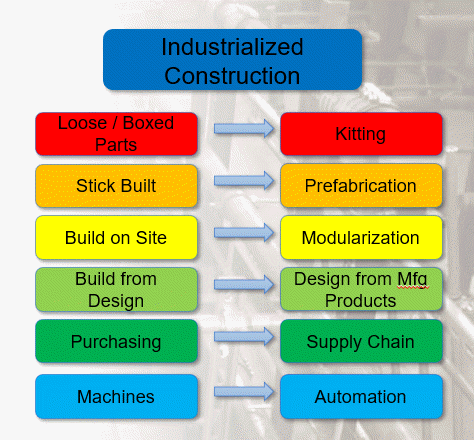
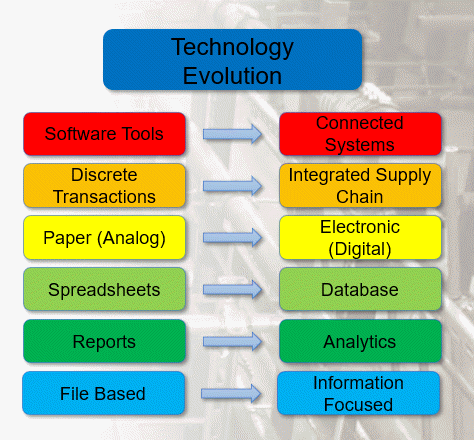
If you look at any of these trends individually, that all seem obvious. Not only obvious, but it’s hard to argue that any of them are negative or harmful. In fact, they all seem like good things. And they are. But when they’re all happening in unison, all these “good things” are creating a lot of the problems the industry is currently experiencing.
The Chaos of Today
To help manage these disruptions, it’s helpful to understand what’s happening today. Below shows an example of today’s workflow. Most groups work in silos. As they work and create more data and information over the duration of a project, they start throwing it over the fence to others within an organization. Meanwhile, other parts or the organization throw data to them.
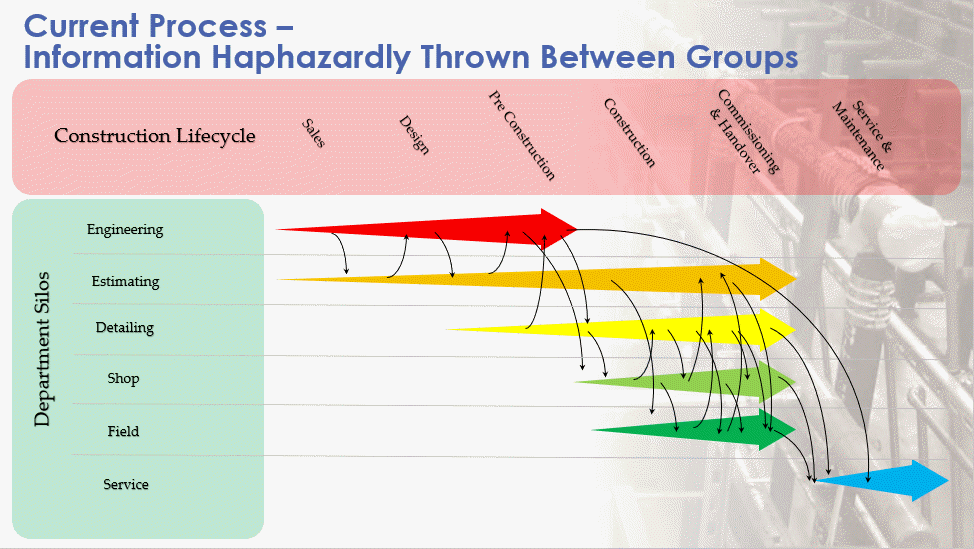
For most this feels like we’re juggling a ball, an egg and a chainsaw. And while we’re juggling we’re also simultaneously in the middle of a game of dodgeball.
So what happens when…
- We forget to throw data to others
- Too much / too little information is thrown
- We don’t catch data thrown to us
- Too much / too little information is caught
- We miss the catch or forget to throw
- Information is caught or thrown early / late
- We loose information
- Information was unclear
- We throw or catch data to fast / slow
- Data is obsolete or unapproved
- We get duplicate data
The Solution for Tomorrow
To combat these problems, we need a new process. The below is what we really want. A single stream of data everyone accesses. With this model, you don’t give anyone data, they inherently have access to the data you have which they need. It’s not a copy of the data or a report of the data. It’s access to the source data. Now, when someone needs information, they have access to it.
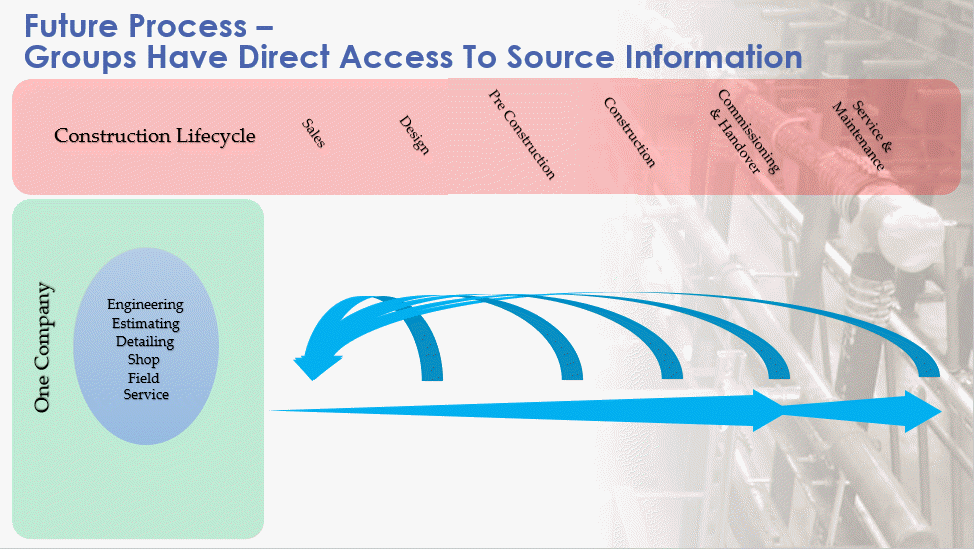
Throughout the construction process, because our data is less fragmented, it’s easy to warehouse. This allows you to better inform design by pulling the historical data from the service group. Sales can now leverage this data to explain the lifecycle savings when your bid may be higher. In reality, any data from any phase can more readily be accessed from any other phase. Quality of the entire process improves when this happens.
A New Technology Stack
This “Future” process is very likely a utopian state we can never fully accomplish. At least not in our lifetime. But that doesn’t mean we can’t get closer. This doesn’t mean we can’t take a more thoughtful and meaningful approach to the solutions we use. The fact is we can. We may still have to use technology we would rather not. Things we can’t integrate as well as we’d like. But we can get closer.
The following are examples of a technology stack portfolio. Key technologies thoughtfully selected which form the backbone of your digital process.
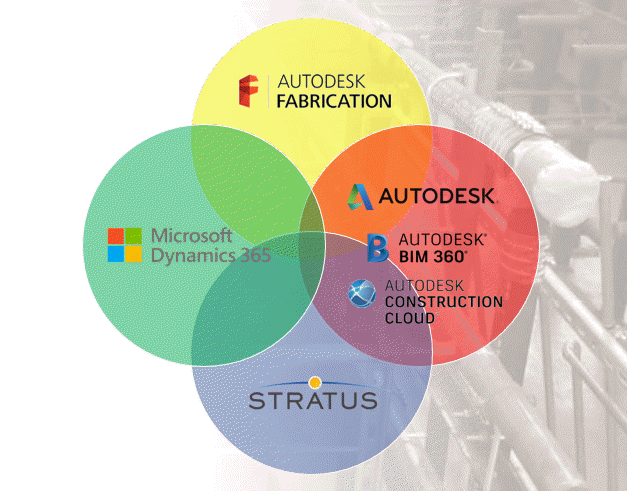
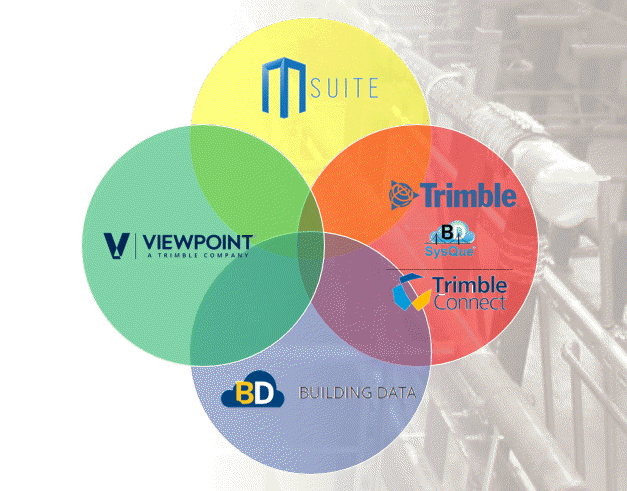
These are just two examples. You don’t have to follow these examples. Your technology stack may be mixed or match differently. You may even have different solutions than those shown in the example.
In these examples, we could use Building Data with Stratus, or Autodesk Fabrication with MSuite. Stratus and MSuite are both model based production management systems. They can both leverage your BIM platform and your BIM content and integrate with your company’s back end ERP system. For a mechanical (or electrical, general, etc.) contractor you can look at a more simplified representation below.
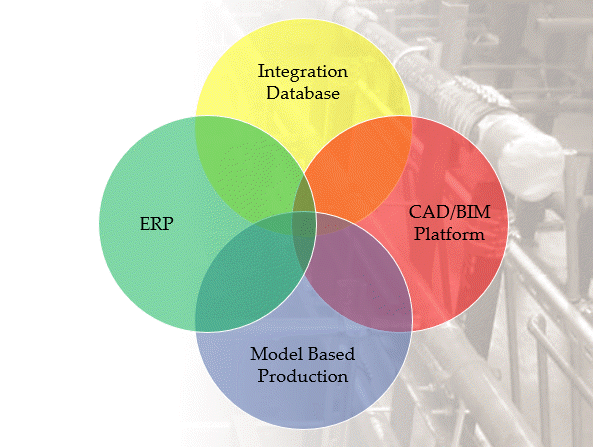
Again, your model may differ. You may have two or three circles. The names in those circles may be different. But you shouldn’t have six or seven or twenty circles. It’s important that you put thought into how these systems can be used and work together. It’s also important that you understand their limitations.
This isn’t to say you don’t use a lot of additional applications. But they shouldn’t be major data stores without connectivity to some of the pillars in your technology stack. Ideally they’ll connect to one of the existing pillars but not be a major pillar in themselves.
Wrapup
This wasn’t really intended to be a roadmap. It’s more of a vision. Something you should be trying to achieve with careful thought and consideration. There’s no magic formula or combination. Nothing you should blindly copy and follow from others. Your technology stack needs to match your organization. The speed and effort to put it place based on your company culture and organizational readiness.
Regardless of how long it takes, the important thing is you’re working toward that vision. We don’t know what the future will bring in our industry. Some things will never change while others may abruptly disrupt your business. No matter what changes are forced upon you, the less impactful these changes will be the closer to this model you are. When required to, you’ll be better positions to respond in an agile manner.
In my next article, I’ll cover some things you can start doing right now that can help prepare you to implement this new model.