For years, I’ve shared my Fabrication COD scripts with the industry. These can be used to examine database content using Excel.
Tyler Phillips of Bruner Corporation recently posted a nice article on LinkedIn about using Microsoft PowerBI. His PowerBI dashboard provides a great way to help visualize the data behind your Autodesk Fabrication content.
Simply put, the scripts I share dump property data to multiple CSV files. Tyler used that data for some of the PowerBI data sources. This allowed him to built a dashboard which helps him visualize and navigate the data in a more meaningful way. And better yet, he publish a fantastic article on LinkedIn that explains how to do it.
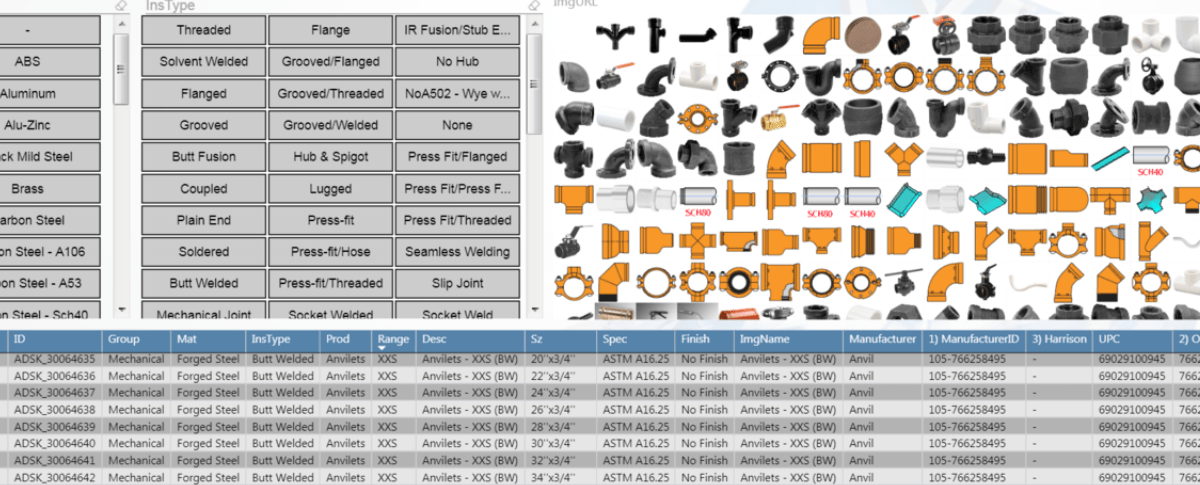
This is a great example of leveraging data from multiple sources. PowerBI help you mash it together to give you meaningful information that’s simple to understand and navigate.
If you’ve ever struggled with ESTmep reporting, just think of the possibilities. By taking the above concept and using it across CSV exports from ESTmep you could easily overcome gaps in estimating reporting.
Great job Tyler! Really appreciate you sharing.